Concepts and Definitions
In studying labour market indicators, we are often interested in knowing the profile of a group in terms of different characteristics. For example,
 |
|
|
|
Distribution of residents in the labour force by sex |
| |
|
|
|
Distribution of employed residents by age |
| |
|
|
|
Distribution of unemployed residents by educational attainment |
| |
|
|
|
Distribution of job vacancies by industry |
| |
|
|
|
Distribution of workers made redundant by occupation |
Distribution data shows how a group can be classified into subgroups based on different characteristics. It expresses the number of units in the subgroup as a percentage of the total number of units in the group being considered.
How to compute percentage distribution?

Step 1: Identify the target group of interest. For example, workers made redundant, employed residents or job vacancies.
Step 2: Obtain the total number of units (e.g. workers, establishments or vacancies) in the target group. Denote this total number by the symbol N.

Step 3: Identify the characteristic you would like to use to classify the target group, e.g. age, education, industry or occupation.
Step 4: Classify the units in the target group (identified in Step 1) into subgroups, using the characteristic identified in Step 3.
Step 5: Compute or obtain the number of units in the different subgroups. Let N1 be the number in subgroup 1, N2 be the number in subgroup 2, and so on.

Step 6: The percentage distribution figures for each subgroup is computed using the following formula.
Example 1 Suppose you want to find out the sex distribution of residents in the labour force in Singapore.
In this case,
the target group is resident labour force in Singapore,
and the characteristic used in the classification is sex.
The number of residents in the labour force in Singapore in June 2010 are as follows:
Total: 2,047,300
Males: 1,151,600
Females: 895,700
The percentage distribution figures are computed as follows:
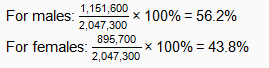
That is, of the 2,047,300 residents in Singapore's labour force in 2010, 56.2% were males and 43.8% were females.
Example 2 Suppose you would like to know the educational profile of unemployed residents in Singapore in June 2010.
In this case,
the target group is unemployed residents in Singapore,
and the characteristic used in the classification is educational attainment (also known as highest qualification attained).
The number of unemployed residents in Singapore in June 2010 are as follows:
Total: 84,400
Below Secondary: 20,600
Secondary: 17,200
Post-Secondary (Non-Tertiary): 11,500
Diploma & Professional Qualification: 14,300
Degree: 20,800
The percentage distribution figures are computed as follows:
/Distribution%20Concepts%20and%20Definitions%2007.JPG)
Of the 84,400 unemployed residents in Singapore in June 2010,
| |
24.4% were below-secondary educated, |
| |
20.4% had secondary education, |
| |
13.6% were from the post-secondary (non-tertiary) group, |
| |
16.9% had diploma/professional qualifications and |
| |
24.6% were degree holders. |