Uses
The most basic application of percentages is to compare one quantity against another, with the second quantity rebased to 100. Let’s say we are interested in the number of employed females as a percentage of all employed.
 |
|
|
|
Essentially, we are comparing the number of employed females with the number of employed people, using the fraction |
/Percentages%20Uses%2001.JPG)
If this fraction is 1/2 , it means in general, for every two employed persons, one is a female.
| |
|
|
|
We convert this to a percentage by multiplying by 100. The formula then becomes |
/Percentages%20Uses%2002.JPG)
Following the previous example, if the fraction is 1/2 , then the percentage of employed females out of all employed is 50%.
In general, percentages can be used in two major ways. Refer to the following figure.
Major Uses of Percentages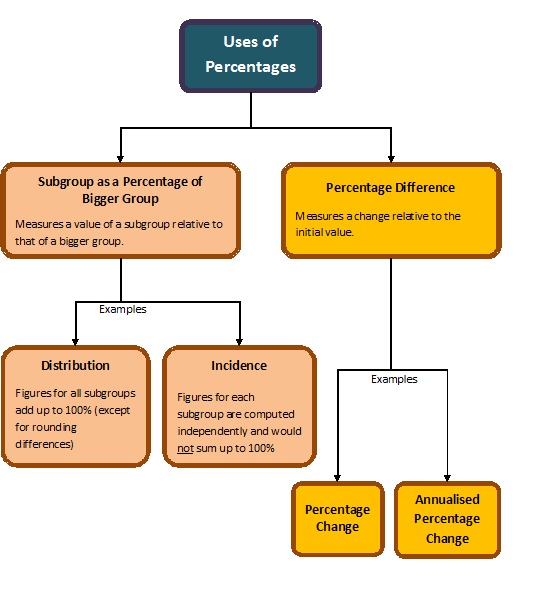
Example 1: Percentage Change
From June 2009 to June 2010, the total labour force grew from 3,030,000 to 3,135,900. The increase was 105,900. What was the percentage increase from 3,030,000?
Since we are comparing the increase with the total labour force value in June 2009, this is the base value. Therefore,
Possible Values of Percentages and What They Mean
Note that although the base is 100, percentages can fall outside the 0 to 100 range; i.e. there may be occasions when percentages are less than 0 or more than 100. What does this signify for percentage of subgroups and percentage change? Refer to the figure below. Additional examples can be found in Example 2.
Interpreting the Possible Values of Percentages
/Percentages%20Uses%2005.JPG)
Example 2: Negative Percentages
The total number of workers made redundant in 2009 was 23,430. In 2010, the number of workers made redundant was 13,630 fewer than in 2009. What is the percentage change in the number of workers made redundant from 2009 to 2010?
Depending on our purpose, the same figure can be computed as a percentage of different bases/benchmarks.
Example 3: Comparing Percentages with Different Bases
Source: Survey on Retirement and Re-employment Practices, 2010, MOM
Note the marked difference in the percentages. For (1) the base used was restricted to private establishments that offered re-employment (all establishments within the red circle). That is, we have excluded establishments that did not offer re-employment from the base. The formula to compute this percentage is
For (2), the wider base of all private establishments was used (all establishments within the orange circle). This means the formula used was
We choose the bases depending on which group we want to compare with. If we are interested to find out how prevalent work performance was as a criterion for offering re-employment, only among establishments who offered re-employment to their employees, the base in (1) may be more suitable. On the other hand, another individual who is studying this issue in relation to all companies in Singapore would find it more appropriate to use the base in (2) to compute the percentage. Therefore, in our analysis, it is important to determine the context for comparison.