
Employment
Understand how employment in Singapore is changing — from the latest quarterly changes to long-term trends and changes across industries.
Last updated on 3 November 2026
In Brief
The number of persons in employment tells us about the economy’s ability to create jobs.
The change in employment sheds light on the impact of economic changes on the labour market.
Industry-level trends help identify where demand for workers is expanding, easing or shifting.
Latest data
+27,700
Employment Change, excl. Migrant Domestic Workers | (3Q 2026)ᴾ
As part of MRSD’s commitment to deliver accurate and relevant statistics, our data collection processes have undergone an assessment by Ernst and Young Advisory Pte Ltd.
Summary tables
Employment level and employment change
Year | 2026 | 2025 | 2024 | 2023 | 2022 | 2021 | 2020 | 2019 | 2018 | 2017 | 2016 |
|---|---|---|---|---|---|---|---|---|---|---|---|
Employment Level as at Year-end ('000) | n.a. | 4,117.0 | 4,046.2 | 3,986.4 | 3,889.8 | 3,629.5 | 3,603.3 | 3,784.3 | 3,714.8 | 3,669.4 | 3,673.1 |
Employment Distribution by Sector as at Year-end (%) | 100.0 | 100.0 | 100.0 | 100.0 | 100.0 | 100.0 | 100.0 | 100.0 | 100.0 | 100.0 | 100.0 |
Manufacturing | n.a. | 12.1 | 12.0 | 12.2 | 12.5 | 12.4 | 12.5 | 12.9 | 13.1 | 13.3 | 13.6 |
Construction | n.a. | 13.8 | 13.3 | 13.2 | 12.8 | 11.2 | 11.2 | 12.0 | 11.9 | 12.3 | 13.3 |
Services | n.a. | 73.5 | 74.0 | 74.0 | 74.1 | 75.8 | 75.6 | 74.4 | 74.2 | 73.7 | 72.3 |
Others | n.a. | 0.6 | 0.7 | 0.6 | 0.6 | 0.7 | 0.7 | 0.7 | 0.7 | 0.7 | 0.7 |
Employment Change ('000) | |||||||||||
Annual | n.a. | 70.8 | 59.8 | 96.7 | 260.3 | 26.2 | -181.0 | 69.5 | 45.3 | -3.6 | 17.1 |
1st Qtr | 13.0 | 6.9 | 8.1 | 39.1 | 51.1 | 10.7 | -25.4 | 13.6 | 3.7 | -6.8 | 12.9 |
2nd Qtr | 14.7 | 12.9 | 14.9 | 24.1 | 71.7 | -24.8 | -113.5 | 6.8 | 6.5 | -7.3 | 4.2 |
3rd Qtr | 32.0p | 30.2 | 24.9 | 25.4 | 86.4 | -13.2 | -34.4 | 27.5 | 19.3 | -2.3 | -2.7 |
4th Qtr | n.a. | 20.8 | 11.9 | 8.0 | 51.1 | 53.5 | -7.8 | 21.6 | 15.9 | 12.7 | 2.6 |
Employment Change (excl MDW) ('000) | |||||||||||
Annual | n.a. | 55.5 | 44.5 | 78.8 | 238.0 | 27.3 | -166.6 | 61.5 | 38.3 | -10.7 | 8.9 |
1st Qtr | 9.4 | 2.3 | 3.2 | 33.5 | 45.7 | 8.8 | -25.8 | 10.9 | 0.4 | -9.4 | 9.5 |
2nd Qtr | 11.4 | 10.4 | 11.3 | 21.7 | 67.1 | -21.2 | -103.8 | 7.5 | 6.5 | -7.9 | 2.1 |
3rd Qtr | 27.7P | 25.1 | 22.3 | 19.8 | 78.8 | -7.1 | -29.1 | 23.2 | 16.7 | -4.1 | -4.2 |
4th Qtr | n.a. | 17.7 | 7.7 | 3.9 | 46.4 | 46.8 | -7.9 | 19.9 | 14.6 | 10.7 | 1.4 |
Source: Administrative Records and Labour Force Survey, Manpower Research & Statistics Department, MOM
Latest figures published in: Labour Market Advance Release
Notes:
Data are compiled primarily from administrative records, with the self-employed estimated from the Labour Force Survey.
The industries are classified based on SSIC 2020.
Residents refer to Singapore Citizens and Permanent Residents.
Change in employment is the difference in the employment level at the end of the reference period compared with the end of the preceding period.
Data for the three major sectors do not add up to the total as the latter includes Agriculture, Fishing, Quarrying, Utilities and Sewerage & Waste Management.
'excl MDW' refers to excluding migrant domestic workers.
Data may not necessarily add up to total due to rounding.
p = Preliminary
n.a. = Not available
Annual employment change by Industry and Residential Status
Employment Level ('000)
Year | Dec 2025 | 2025 | 2024 | 2023 | 2022 | 2021 | 2020 | 2019 | 2018 | 2017 | 2016 |
|---|---|---|---|---|---|---|---|---|---|---|---|
Overall | |||||||||||
Total | 4,117.0 | 70.8 | 59.8 | 96.7 | 260.3 | 26.2 | -181.0 | 69.5 | 45.3 | -3.6 | 17.1 |
Total (excl MDW) | 3,800.1 | 55.5 | 44.5 | 78.8 | 238.0 | 27.3 | -166.6 | 61.5 | 38.3 | -10.7 | 8.9 |
Resident | 2,481.3 | 11.6 | 8.8 | -4.6 | 36.5 | 57.3 | 14.9 | 28.0 | 27.4 | 21.3 | 11.4 |
Non-Resident | 1,635.7 | 59.2 | 51.0 | 101.3 | 223.8 | -31.1 | -195.9 | 41.5 | 17.9 | -24.9 | 5.7 |
Non-Resident (excl MDW) | 1,318.8 | 43.9 | 35.7 | 83.5 | 201.6 | -30.0 | -181.5 | 33.4 | 10.9 | -32.0 | -2.5 |
Manufacturing | |||||||||||
Total | 498.2 | 8.4 | -0.9 | 2.2 | 33.9 | -2.0 | -37.0 | -2.1 | -2.1 | -11.1 | -15.0 |
Resident | 237.5 | 0.3 | -7.5 | -1.5 | -0.9 | -0.3 | -2.9 | -2.0 | -1.5 | -1.3 | -6.1 |
Non-Resident | 260.7 | 8.0 | 6.6 | 3.7 | 34.9 | -1.7 | -34.1 | -0.1 | -0.6 | -9.8 | -8.9 |
Construction | |||||||||||
Total | 567.7 | 27.3 | 11.5 | 29.2 | 91.0 | 2.6 | -51.8 | 12.4 | -7.1 | -38.4 | -11.8 |
Resident | 123.8 | 1.3 | 0.2 | 3.2 | 1.2 | 0.7 | 1.0 | -1.7 | -1.7 | -5.7 | -1.6 |
Non-Resident | 443.9 | 26.0 | 11.4 | 26.0 | 89.8 | 1.9 | -52.7 | 14.1 | -5.4 | -32.7 | -10.2 |
Services | |||||||||||
Total | 3,024.3 | 34.9 | 50.0 | 64.6 | 135.3 | 25.2 | -92.1 | 59.4 | 54.7 | 46.4 | 44.0 |
Total (excl MDW) | 2,707.4 | 19.6 | 34.7 | 46.8 | 113.1 | 26.3 | -77.6 | 51.4 | 47.6 | 39.4 | 35.8 |
Resident | 2,098.8 | 9.6 | 17.2 | -6.7 | 36.8 | 56.3 | 16.6 | 32.0 | 31.1 | 28.9 | 19.4 |
Non-Resident | 925.5 | 25.2 | 32.8 | 71.3 | 98.5 | -31.1 | -108.7 | 27.4 | 23.6 | 17.5 | 24.7 |
Non-Resident (excl MDW) | 608.6 | 10.0 | 17.5 | 53.5 | 76.3 | -30.0 | -94.3 | 19.3 | 16.6 | 10.5 | 16.5 |
Source: Administrative Records and Labour Force Survey, Manpower Research & Statistics Department, MOM
Latest figures published in: Labour Market Report
Notes:
Data are compiled primarily from administrative records, with the self-employed estimated from the Labour Force Survey.
The industries are classified based on SSIC 2020.
Residents refer to Singapore Citizens and Permanent Residents.
Change in employment is the difference in the employment level at the end of the reference period compared with the end of the preceding period.
Data for the three major sectors do not add up to the total as the latter includes Agriculture, Fishing, Quarrying, Utilities and Sewerage & Waste Management.
'excl MDW' refers to excluding migrant domestic workers.
Data may not necessarily add up to total due to rounding.
Data for Dec 2025 are revised to reflect updates in industry classification of firms.
p = Preliminary
n.a. = Not available
Understanding employment statistics
Employment Level
The number of persons in employment, comprising employees and the self-employed.
Employment Change
The net difference in employment levels over time, which helps us understand the impact of economic changes on the demand for workers. A positive change refers to the additional number of persons who are in employment, while a negative change refers to the decline in number of persons in employment. The data, which are available by industry, allow users to identify industries where employment is growing or falling.
Employment Rate
Also known as employment to population ratio, employment rate refers to the proportion of employed persons in the working-age population. The employment rate tells us the extent to which the population is engaged in productive labour market activity. It provides a basis for labour market comparisons across economies.
How employment data is compiled
Singapore’s employment statistics are compiled from two major sources:
Administrative records
Used for headline employment statistics, including quarterly employment change and industry-level trends.
Comprehensive Labour Force Survey
Used for annual data on the demographic and socioeconomic characteristics of employed persons.
Employment data sources
Administrative records
Administrative records provide timely quarterly employment estimates. They draw on CPF records, MOM work pass records and Labour Force Survey estimates for the self-employed.
They are useful for tracking employment change, sectoral shifts and how labour demand responds to economic conditions.
Source and Coverage
Headline employment data are compiled mainly from administrative records. The self-employed component is estimated from the Labour Force Survey. Employment data covers all persons in employment, excluding full-time national servicemen.
• Resident employees - drawn from CPF Board records of active contributors. A resident employee is a Singapore citizen or Permanent Resident who is employed by an employer under a contract of service or other agreement entered into in Singapore. Every resident employee and his/her employer are required to make monthly contributions to the CPF. The CPF is a compulsory savings scheme that provides workers financial security in old age and helps meet the needs of healthcare, home-ownership, family protection and asset enhancement.
• Non-residents - compiled from MOM work pass administrative records. Non-residents can work in Singapore only if they have valid work passes issued by the Ministry of Manpower.
• Self-employed - estimated from the Labour Force Survey, including own account workers, employers, and contributing family workers aged 15 and over.
Uses and Limitations
Administrative records are particularly useful for tracking quarterly employment change and sector-level movements.
Employment change reflects the net difference between employment gains and losses. It should not be interpreted as the total number of new jobs created.
Comprehensive Labour Force Survey
The Comprehensive Labour Force Survey provides annual information on the characteristics of employed persons, including demographic, social and economic breakdowns.
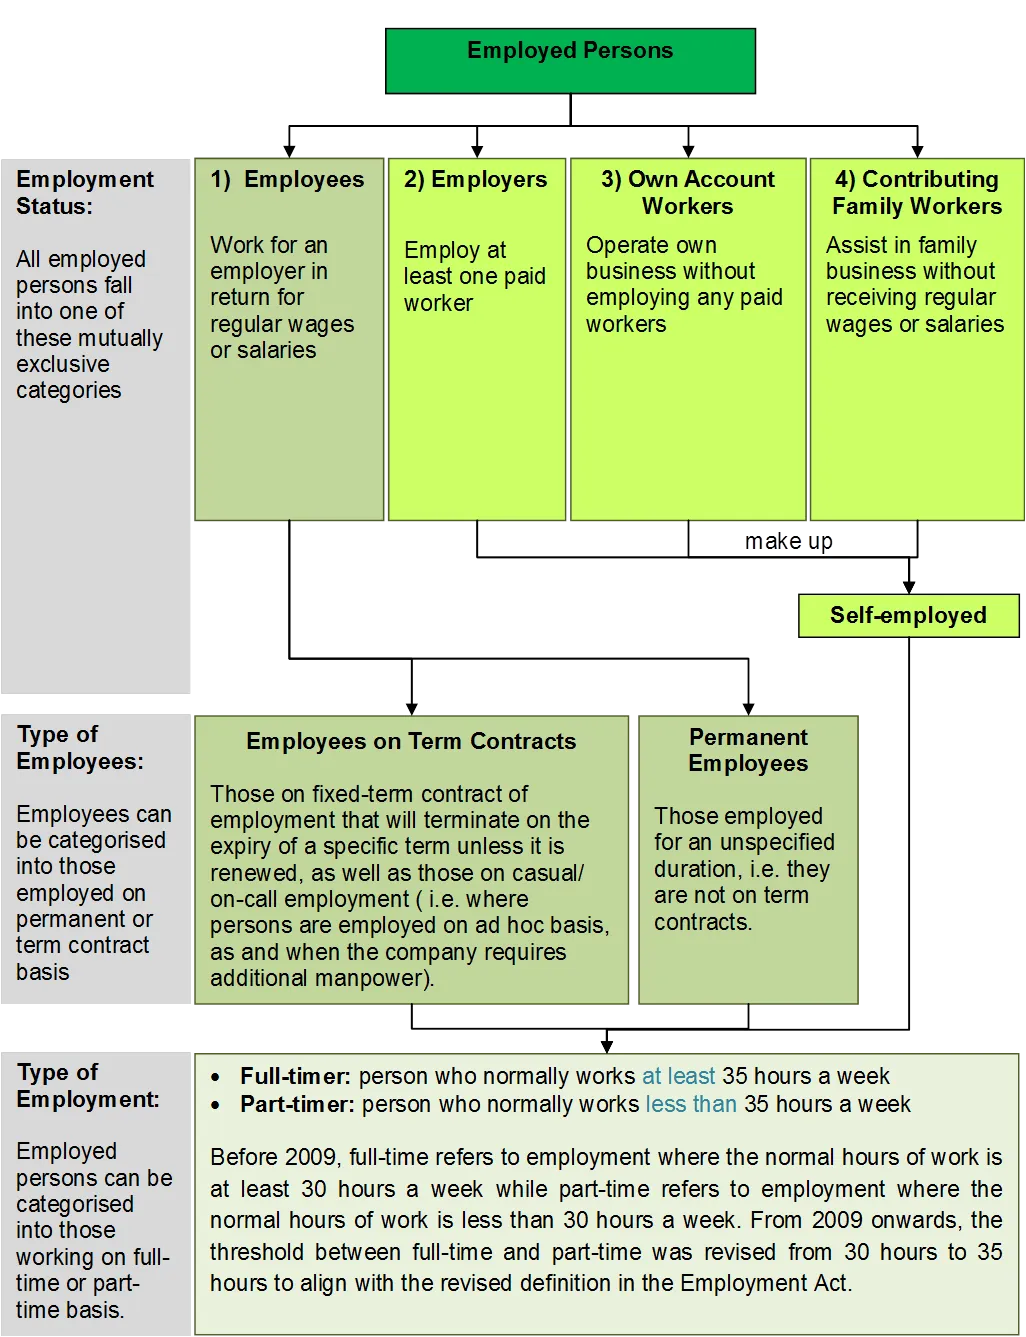
Different groups within employment
Concepts and Definitions
In the Labour Force Survey, employed persons are those aged 15 and over who, during the reference period:
• Worked for one hour or more, either for pay or profit; or
• Had a job or business to return to but were temporarily absent due to illness, injury, machinery breakdown, labour dispute, or other reasons.
Note: Members of the Singapore Armed Forces, including full-time National Servicemen, are included in the employed population unless otherwise specified. Definitions follow ILO international guidelines.
Source and Coverage
The mid-year survey covers private households in Singapore and collects information on the demographic and socioeconomic characteristics of employed persons.
It excludes workers living in construction worksites, dormitories, or workers’ quarters at the workplace, as well as persons commuting from abroad.
Total labour force estimates combine resident data from the survey with non-resident employment data from administrative records.
Uses and Limitations
The Comprehensive Labour Force Survey supports more detailed analysis of the employed population, including breakdowns by age, sex, marital status, educational attainment, occupation, industry and income.
As the estimates are derived from a sample survey, results are subject to sampling and non-sampling errors. More caution is needed when interpreting detailed cross-tabulations for small sub-groups, which may have larger sampling errors.