
Hours Worked
Understand the different measures of hours worked in Singapore, including paid hours worked, usual hours worked and actual hours worked.
Last updated on 10 November 2026
In Brief
Hours worked are used to monitor working conditions, analyse economic developments and assess workers’ well-being, labour productivity through three measures.
Paid Hours Worked are hours employees are paid for, including standard hours, paid overtime and paid leave
Usual Hours Worked are hours typically worked each week, including regular paid or unpaid overtime.
Actual Hours Worked are hours actually spent working, regardless of whether they are regular or paid.
As part of MRSD’s commitment to deliver accurate and relevant statistics, our data collection processes have undergone an assessment by Ernst and Young Advisory Pte Ltd.
Latest data
43.0↑
Average Weekly Paid Hours Worked per Employee | (Jun 2026)
1.7
Average Weekly Paid Overtime Hours Worked per Employee | (Jun 2026)
Summary table
Paid Hours Worked (Per Week)
Year | 2026 | 2025 | 2024 | 2023 | 2022 | 2021 | 2020 | 2019 | 2018 | 2017 | 2016 |
|---|---|---|---|---|---|---|---|---|---|---|---|
Total Paid Hours | |||||||||||
Annual Average | n.a. | 43.1 | 43.3 | 43.6 | 44.1 | 44.2 | 44.0 | 44.7 | 44.8 | 45.1 | 45.5 |
As at Mar | 42.9 | 43.1 | 43.3 | 43.7 | 44.2 | 44.2 | 44.4 | 44.6 | 44.8 | 45.2 | 45.5 |
As at Jun | 43.0 | 43.2 | 43.3 | 43.4 | 43.8 | 44.3 | 43.4 | 44.7 | 44.9 | 45.2 | 45.6 |
As at Sep | n.a. | 43.1 | 43.3 | 43.7 | 44.0 | 44.3 | 43.8 | 44.7 | 44.9 | 45.1 | 45.6 |
As at Dec | n.a. | 43.0 | 43.2 | 43.4 | 44.2 | 44.2 | 44.3 | 44.7 | 44.7 | 45.0 | 45.3 |
Paid Overtime Hours | |||||||||||
Annual Average | n.a. | 1.9 | 2.0 | 2.2 | 2.5 | 2.5 | 2.0 | 2.7 | 2.8 | 3.0 | 3.3 |
As at Mar | 1.7 | 1.9 | 2.0 | 2.3 | 2.5 | 2.4 | 2.4 | 2.6 | 2.8 | 3.0 | 3.3 |
As at Jun | 1.7 | 2.0 | 2.0 | 2.1 | 2.4 | 2.5 | 1.4 | 2.7 | 2.9 | 3.0 | 3.4 |
As at Sep | n.a. | 1.8 | 2.1 | 2.3 | 2.4 | 2.6 | 1.9 | 2.8 | 2.9 | 3.0 | 3.3 |
As at Dec | n.a. | 1.8 | 2.1 | 2.3 | 2.7 | 2.4 | 2.4 | 2.7 | 2.7 | 2.9 | 3.1 |
Source: Labour Market Survey, Manpower Research & Statistics Department, MOM
Latest figures published in: Labour Market Report
Notes:
Data pertain to private sector establishments (each with at least 25 employees) and the public sector.
Annual figures are the simple averages of the figures obtained at quarterly intervals.
n.a. = Not available
Usual Hours Worked (Per Week)
Mid Year | 2025 | 2024 | 2023 | 2022 | 2021 | 2020 | 2019 | 2018 | 2017 | 2016 | 2015 |
|---|---|---|---|---|---|---|---|---|---|---|---|
Usual Hours Worked Per | |||||||||||
Total | 41.4 | 41.6 | 41.9 | 42.2 | 42.4 | 42.8 | 42.9 | 43.0 | 43.2 | 43.4 | 44.2 |
Full-Time | 43.8 | 44.1 | 44.5 | 44.6 | 45.0 | 45.4 | 45.8 | 45.8 | 45.9 | 46.1 | 47.0 |
Part-Time | 20.3 | 21.1 | 21.0 | 21.6 | 21.5 | 21.2 | 21.1 | 20.9 | 20.6 | 21.3 | 21.1 |
Source: Comprehensive Labour Force Survey, Manpower Research & Statistics Department, MOM
Latest figures published in: Labour Force in Singapore
Notes:
Data exclude full-time National Servicemen.
Data are for mid-year.
Usual hours worked refers to the number of hours that a person usually works in a typical week, regardless of whether he is paid or not.
Residents refer to Singapore Citizens and Permanent Residents.
Full-time refers to employment where the normal hours of work is at least 35 hours a week. Part-time refers to employment where the normal hours of work is less than 35 hours a week.
Actual Hours Worked (Per Week)
Year | 2026 | 2025 | 2024 | 2023 | 2022 | 2021 | 2020 | 2019 | 2018 | 2017 |
|---|---|---|---|---|---|---|---|---|---|---|
Actual Hours Worked Per | ||||||||||
Annual Average | n.a. | 43.5 | 43.3 | 43.8 | 44.3 | 44.4 | 42.6 | 44.7 | 44.2 | 44.8 |
1st Qtr | 43.3 | 43.0 | 43.1 | 44.2 | 43.9 | 44.0 | 44.4 | 43.7 | 43.8 | 44.4 |
2nd Qtr | 43.5 | 43.6 | 43.2 | 44.0 | 44.1 | 44.2 | 38.4 | 44.6 | 43.8 | 45.0 |
3rd Qtr | 44.0P | 43.7 | 43.4 | 43.5 | 44.6 | 44.8 | 43.2 | 45.3 | 44.8 | 44.9 |
4th Qtr | n.a. | 43.5 | 43.4 | 43.3 | 44.7 | 44.7 | 44.5 | 45.1 | 44.5 | 44.8 |
Source: Labour Force Survey, Manpower Research & Statistics Department, MOM
Notes:
Data exclude full-time National Servicemen.
Annual figures are the simple averages of each quarter's figures.
p = Preliminary
n.a. = Not available
Understanding hours worked
Paid Hours Worked
This refers to all periods of time for which employees receive payment from their employer, regardless of whether the hours are actually worked.
It includes one’s standard hours of work: commonly stipulated in the employment contract, as well as any paid overtime hours. Time that is paid for but not worked, such as annual leave, public holidays and sick leave, are also covered.
It excludes unpaid overtime put in by employees, such as those by executives. Hours worked by self-employed persons are also not captured, as they do not receive salary as remuneration.
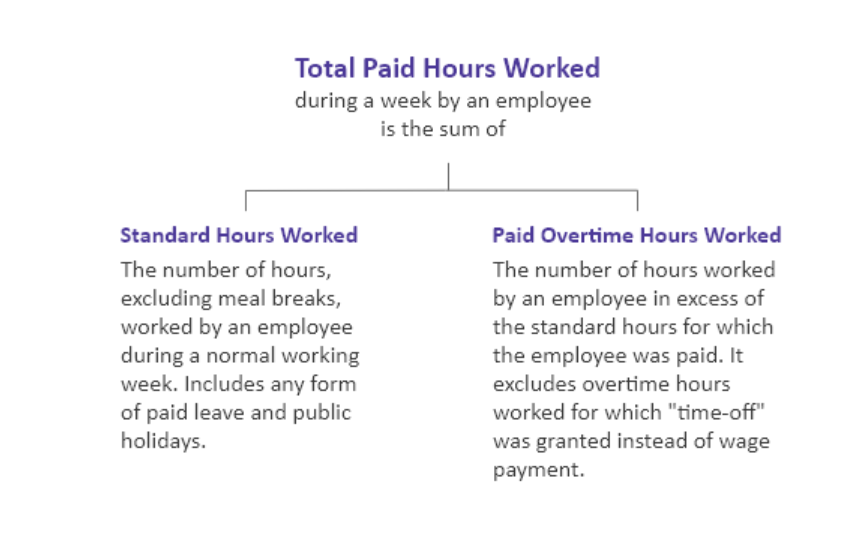
Total Paid Hours Worked during a week by an employee is the sum of:
Standard Hours Worked:
The number of hours excluding meal breaks, worked by an employee during a normal working week. Includes any form of paid leave and public holidays.Paid Overtime Hours Worked:
The number of overtime hours worked by an employee in excess of the standard hours for which the employee was paid. It excludes overtime hours worked for which "time-off" was granted instead of wage payment.
Usual Hours Worked
This refers to the hours that an employed person typically works in any given week, regardless of whether they are paid for it.
It includes the overtime hours that are regularly put in, even if they are unpaid. For persons who hold multiple jobs, this measure captures the sum of hours worked in all jobs.
As the measure covers one’s typical weekly work schedule, irregular arrangements (e.g. annual leave, public holidays, sick leave, ad-hoc overtime) are not taken into account since they are not recurrent over a long observation period.
Actual Hours Worked
This refers to the actual time spent by employed persons on work activities, regardless of whether the hours are regular in nature or whether they are paid for.
It includes all forms of overtime hours of work. Similar to usual hours worked, it covers the time put in for all jobs that an individual held during the reference period.
It excludes all the time that is spent away from work, even if that time is paid for.
How statistics on hours worked are compiled
Paid Hours Worked
Source and Coverage
Data are compiled quarterly from the Labour Market Survey.
Before 2006, the survey covered private sector establishments each with at least 25 employees. From 2006 onwards, the survey also includes the public sector comprising government ministries, organs of state and statutory boards.
Uses and Limitations
Paid hours worked signal the level of economic activities and working conditions of the various industries. It can act as a leading indicator for potential changes in business conditions, as firms typically find it easier to adjust work hours than their headcount to suit initial transitions in business conditions.
The data, however, do not capture unpaid overtime worked (e.g. by executives and management staff who are normally not paid for working overtime). Users can refer to the statistics on Usual Hours Worked collected from the mid-year Comprehensive Labour Force Survey which captures the number of hours a person usually works in a week, whether paid or not.
Usual Hours Worked
Source and Coverage
Data on usual hours worked are compiled from the mid-year Comprehensive Labour Force Survey.
The survey covers private households on the main island of Singapore. It excludes workers living in construction worksites, dormitories and workers’ quarters at the workplace, and persons commuting from abroad to work in Singapore.
Uses and Limitations
Usual hours worked differs from the standard weekly hours of work based on contractual arrangements. For example, a worker could have standard weekly hours of work of 42 hours, but whose weekly usual hours worked may be higher because they regularly work more than 42 hours a week.
It is used frequently to assess the quality of employment and well-being, due to its implication on workers’ health and safety. To identify groups with higher hours worked, the mean usual hours worked and distribution of hours worked are available for various demographic profiles.
It can also be used to provide a sense if people are engaged in work for extreme hours over a prolonged period. This measure of employed persons working excessive hours contributes to several international frameworks on measuring job quality.
Data on usual hours worked, including the proportion of employed residents who work excessive hours, are published in the annual Labour Force in Singapore report.
Actual Hours Worked
Source and Coverage
Data on actual hours worked are compiled from the Labour Force Survey.
The survey covers private households on the main island of Singapore. It excludes workers living in construction worksites, dormitories and workers’ quarters at the workplace, and persons commuting from abroad to work in Singapore.
Uses and Limitations
Actual hours worked are regarded by the International Labour Organisation to be a reflective measure of the amount of labour input in the economy. Labour productivity, as the measure of how efficiently labour inputs are used to produce a given level of output, commonly uses actual hours worked in the computation of real value-added (VA) per hour worked.