Uses
Data on the 75th and 25th percentile values, together with the
median, can be used for benchmarking.
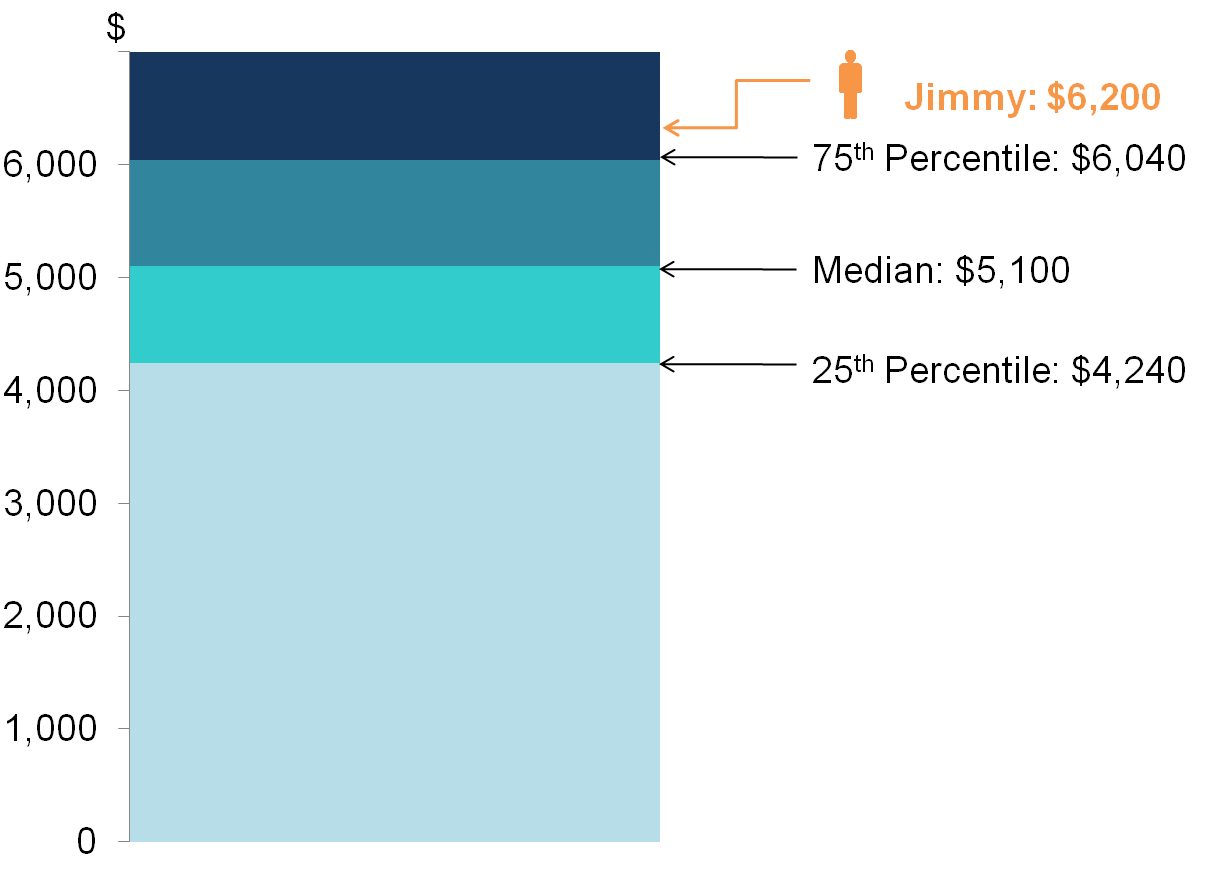
Suppose Jimmy works as a software developer in the information & communications industry. He earns a monthly gross wage of $6,200. He would like to find out how his wages compare with those working in the same occupation and industry.
He obtained data on the 25th percentile, median and 75th percentile wage levels of software developers in the information & communications industry.
The data show that Jimmy’s wage is above the 75th percentile gross wage for software developers in the information & communications industry. That is, he is among the top 25% of earners among software developers in the industry.
Gross Wage of Software Developers
in Information & Communications Industry
Comparing spread across data sets with the same median
Data on the 25th percentile, 75th percentile and interquartile range help to give an indication of the spread of the set of data being considered. Specifically, the 25th and 75th percentiles are the lower and upper bounds respectively of the middle 50% of observations in the dataset.
As an example, consider the following data on the 25th percentile, median and 75th percentile wage levels for two occupations, A and B. Suppose that occupations A and B share the same median wage.
Wages of Occupations A and B (Same Median)
The middle 50% of wages for occupation A ranged from $2,000 to $4,000. For occupation B, the middle 50% of wages fall within a wider range from $1,000 to $5,000. This suggests that wages for occupation B are more spread out compared with occupation A.
Comparing spread across data sets with different or unknown median
To compare the spread of two sets of data with different median values or if we do not know the median values, one can compute the ratio of the 75th percentile to 25th percentile values for these datasets.
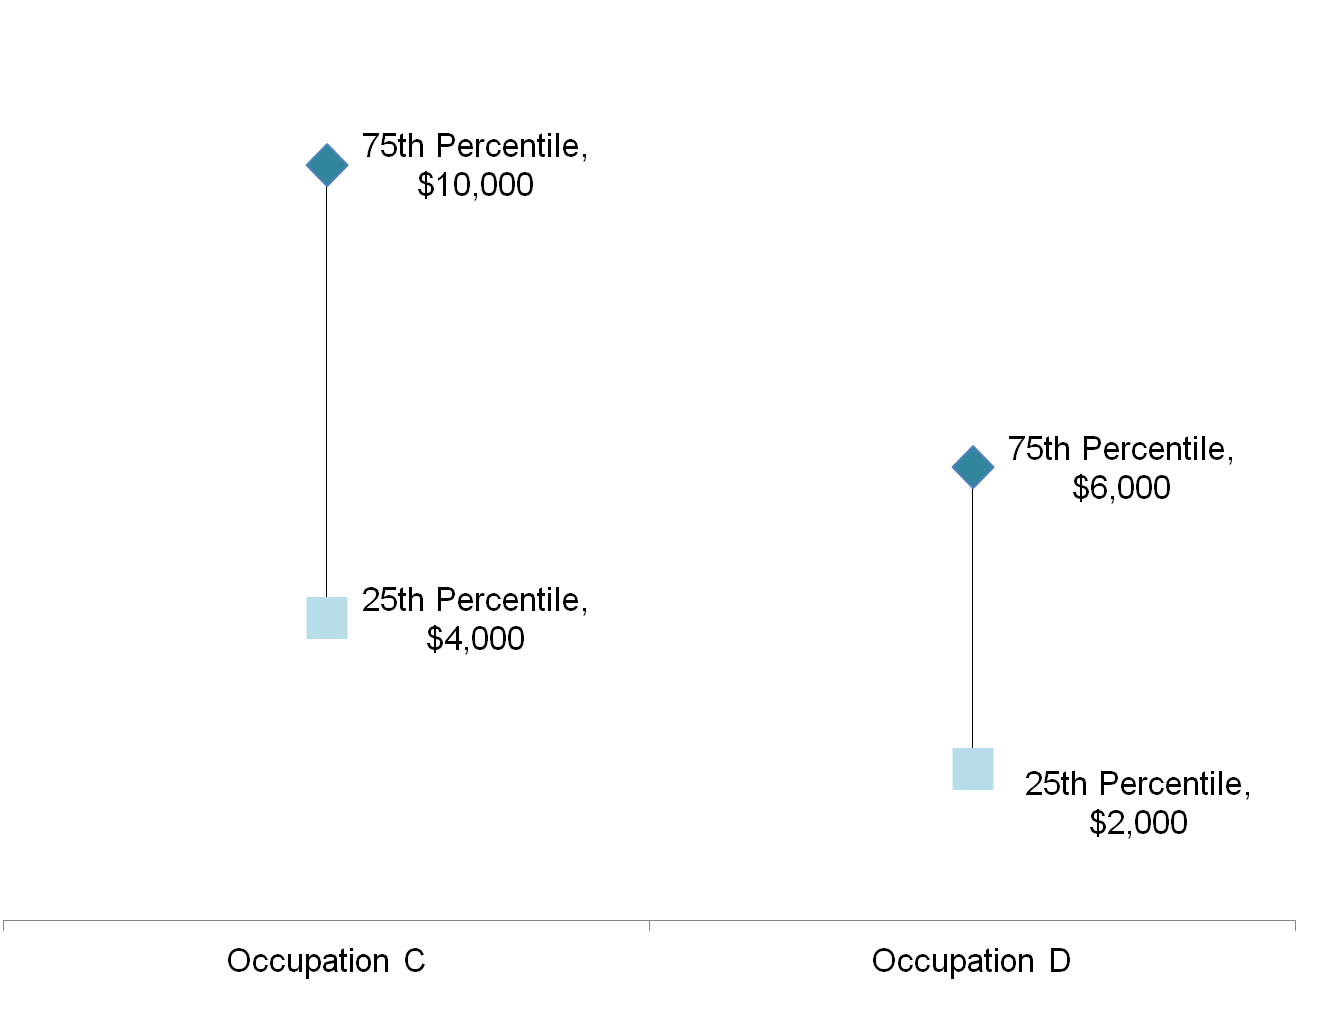
To illustrate, consider occupations C and D respectively (see figure below).
Since the ratio for occupation D (3.0) is larger than that for occupation C (2.5), wages for occupation D are more spread out than occupation C, even though its interquartile range is narrower than occupation C.
Wages of Occupations C and D