
Annualised Percentage Growth
Understanding the concept of annualised percentage growth, its uses and limitations
Last updated on 1 November 2026
Understanding annualised percentage growth
The annualised percentage growth of a variable over a given period of time refers to the equivalent average rate of growth per annum that will give us the same growth rate as that observed over the entire time span.
Example 1
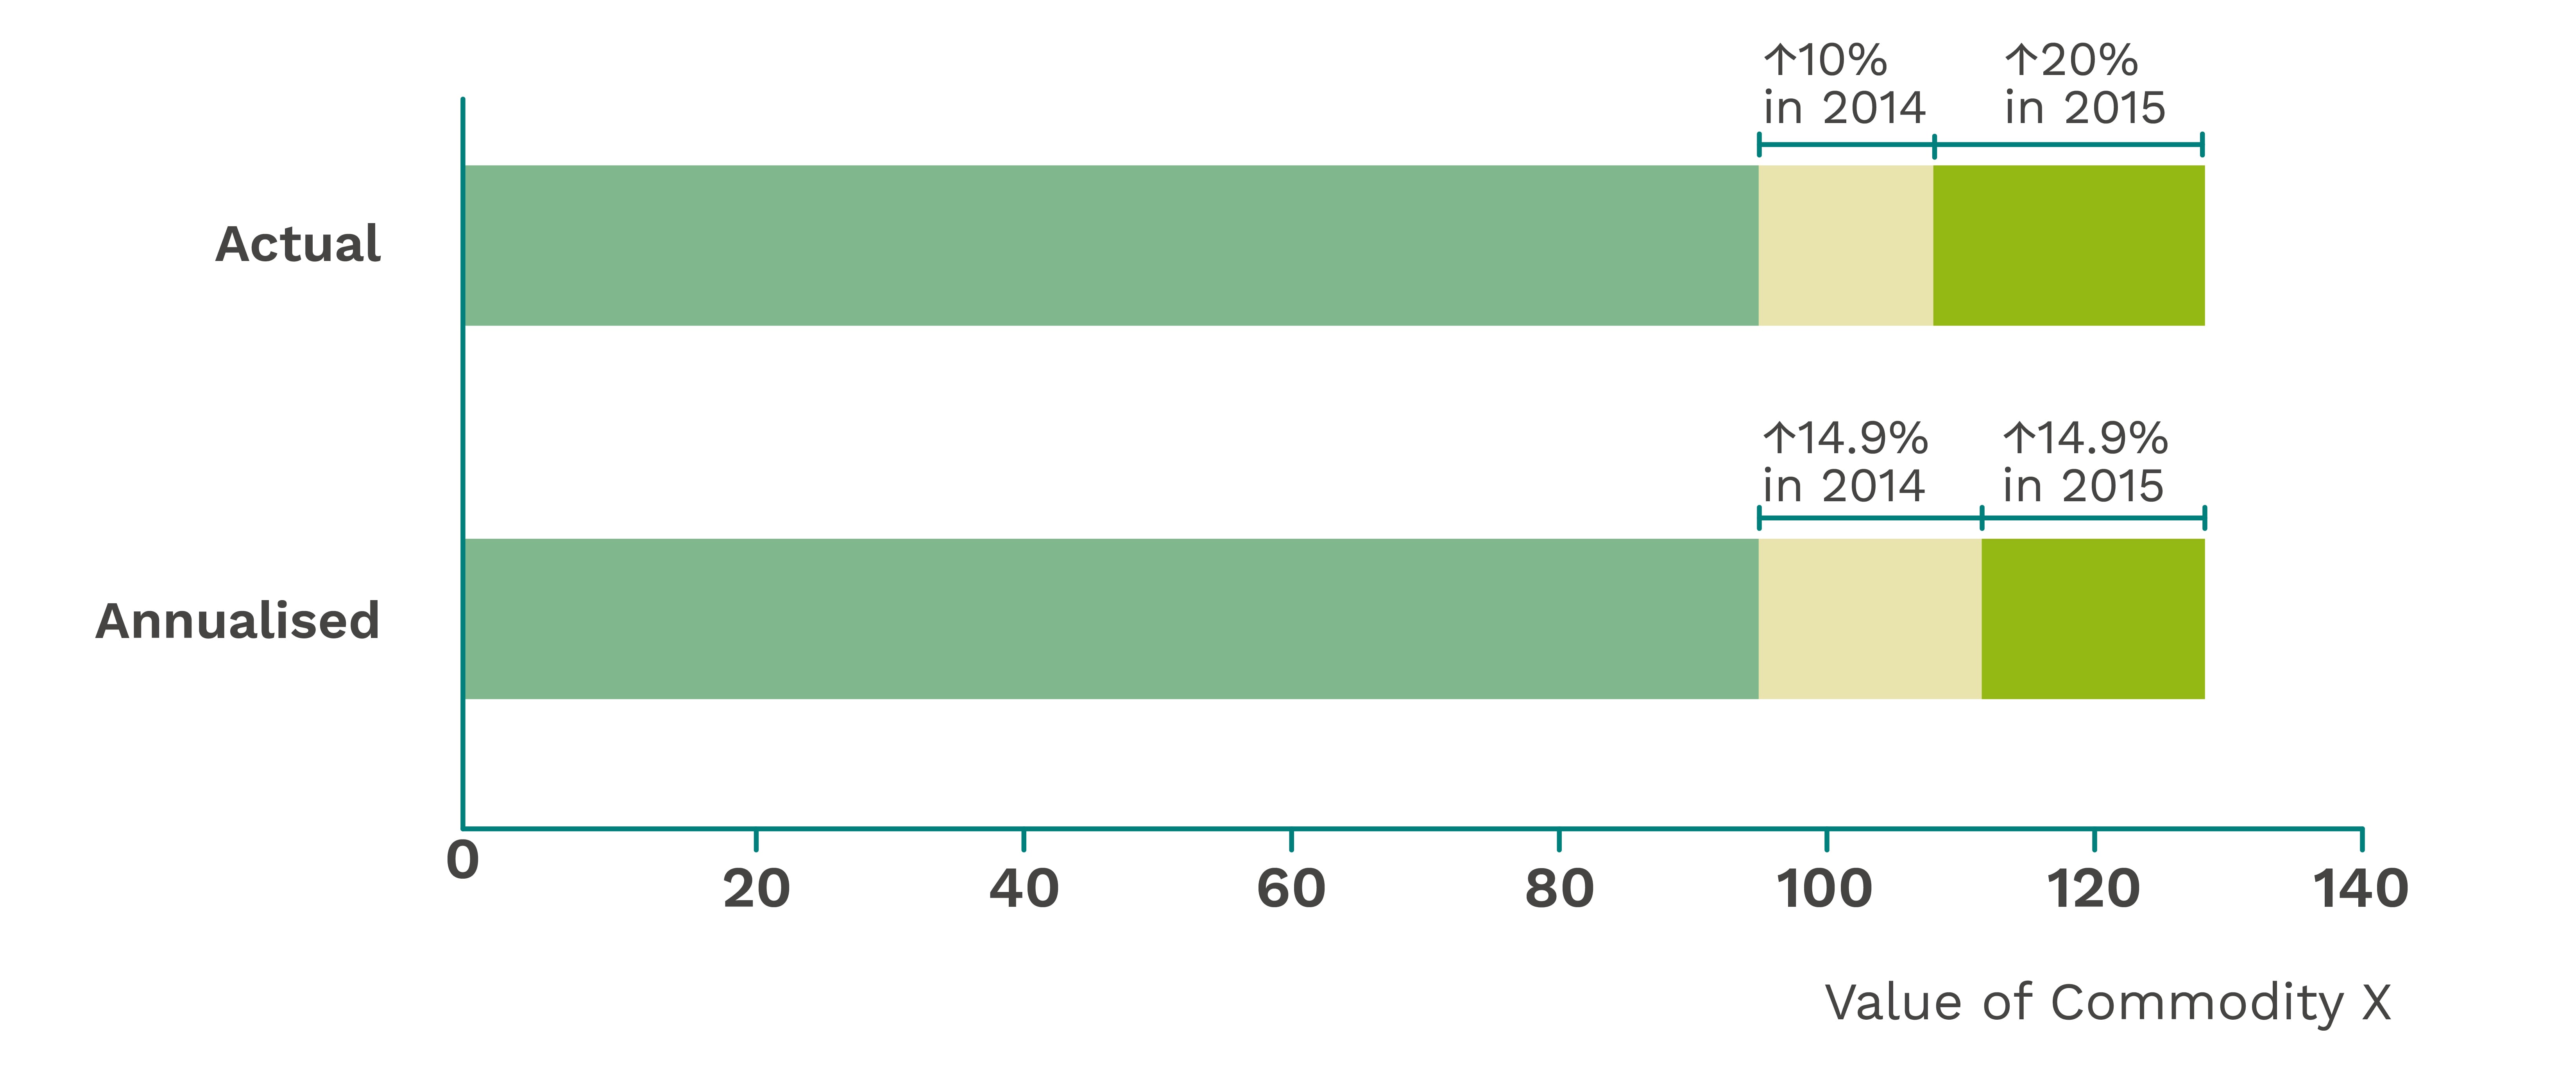
Suppose the value of commodity X was 100 in year 2013, rising by 10% to 110 in year 2014 and another 20% to 132 in year 2015.
The annualised rate of growth for commodity X over the 2-year period is 14.9% per annum (p.a.), as this is the equivalent annual rate of growth that will also result in the value of commodity X increasing from 100 in year 2013 to 132 in year 2015.
(1) Given beginning and end levels
Let:
X1 be the level at the beginning of the period
X2 be the level at the end of the period
t be the length of the time period (in years)
r be the annualised rate of growth (in per cent per annum)
Then the annualised rate of growth, r is:
.png)
Example 2
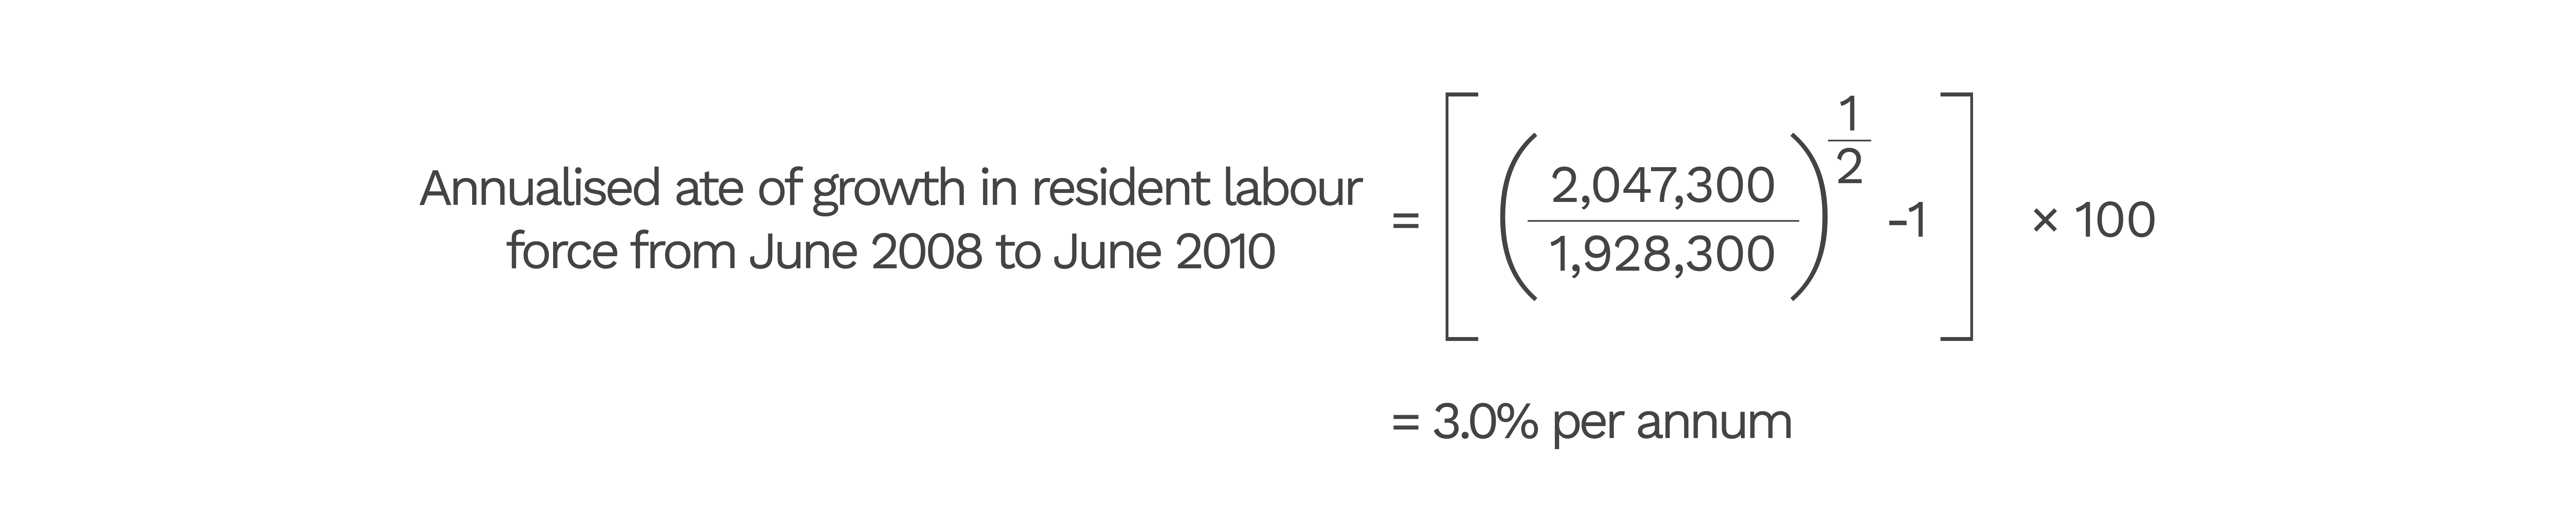
There were 1,928,300 residents in the labour force in June 2008 and 2,047,300 residents in the labour force in June 2010.
(2) Given growth rates for the respective years
Let:
r1 be the growth rate in year 1 (in per cent)
r2 be the growth rate in year 2 (in per cent)
rt be the growth rate in year t (in per cent)
t be the length of the time period (in years)
r be the annualised rate of growth (in per cent per annum)
Then the annualised rate of growth, r is:

Example 3
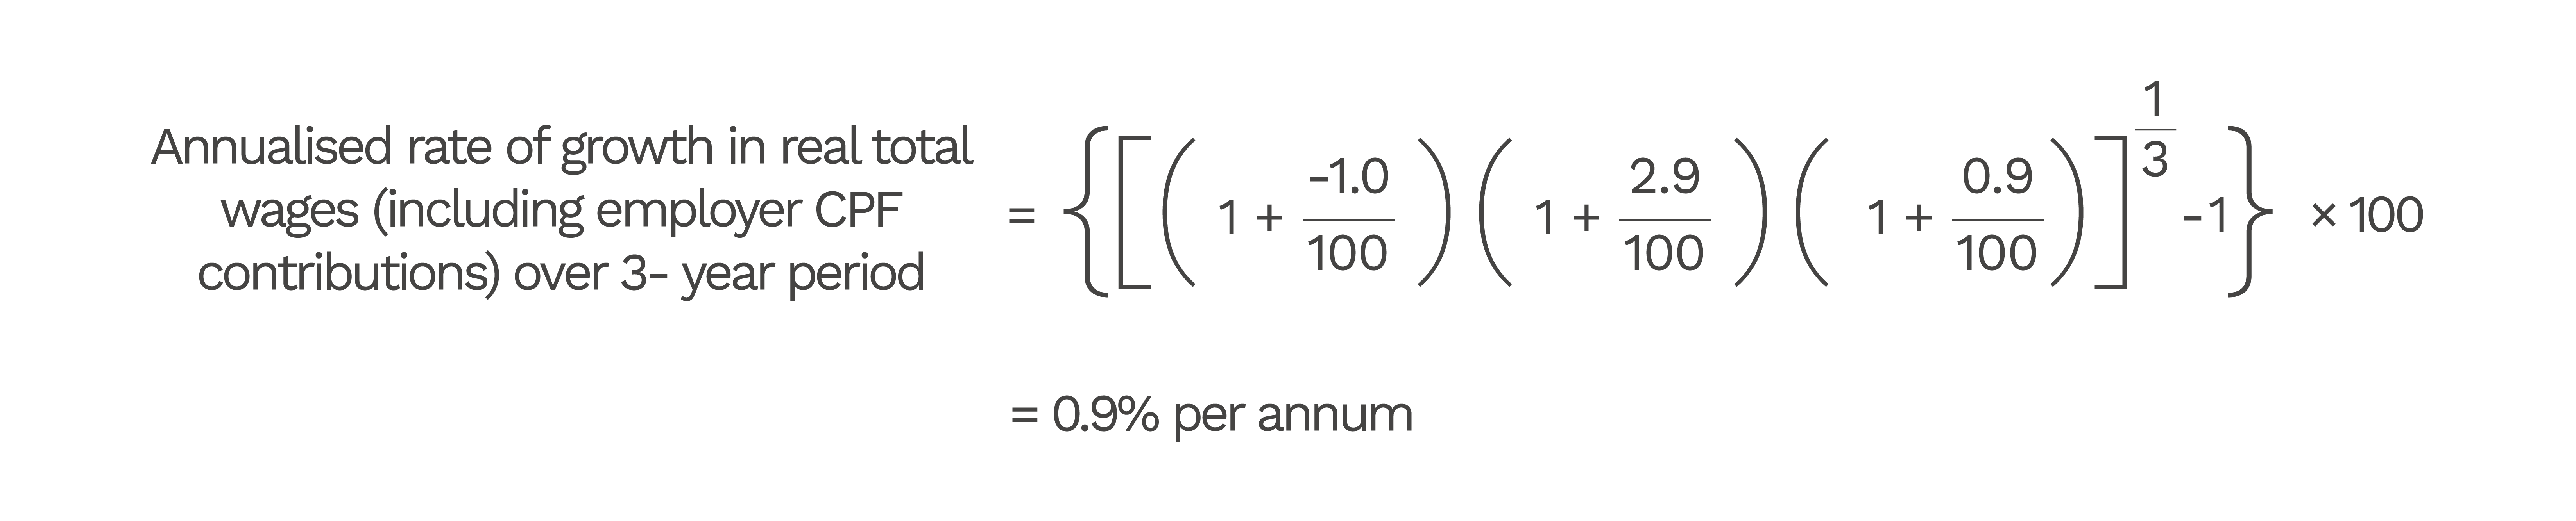
Real total wages (including employer CPF contributions) fell by 1.0% in 2009, rose by 2.9% in 2010, and rose by 0.9% in 2011.
(3) Given the cumulative growth rate for the entire period
Let:
R be the cumulative growth rate for the entire period (in per cent)
t be the length of the time period (in years)
r be the annualised rate of growth (in per cent per annum)
Then the annualised rate of growth, r is:

Example 4
Johnny’s wages in 2025 was 50% higher than in 2022.

Uses of annualised percentage growth
The concept of annualised growth rate is especially useful if we need to compare the performance of an indicator over two unequal periods of time.
Example 5
Suppose Adam’s wages grew by 10% over the 5 years from 2019 to 2024, and by 6% over the 2 years from 2024 to 2026.
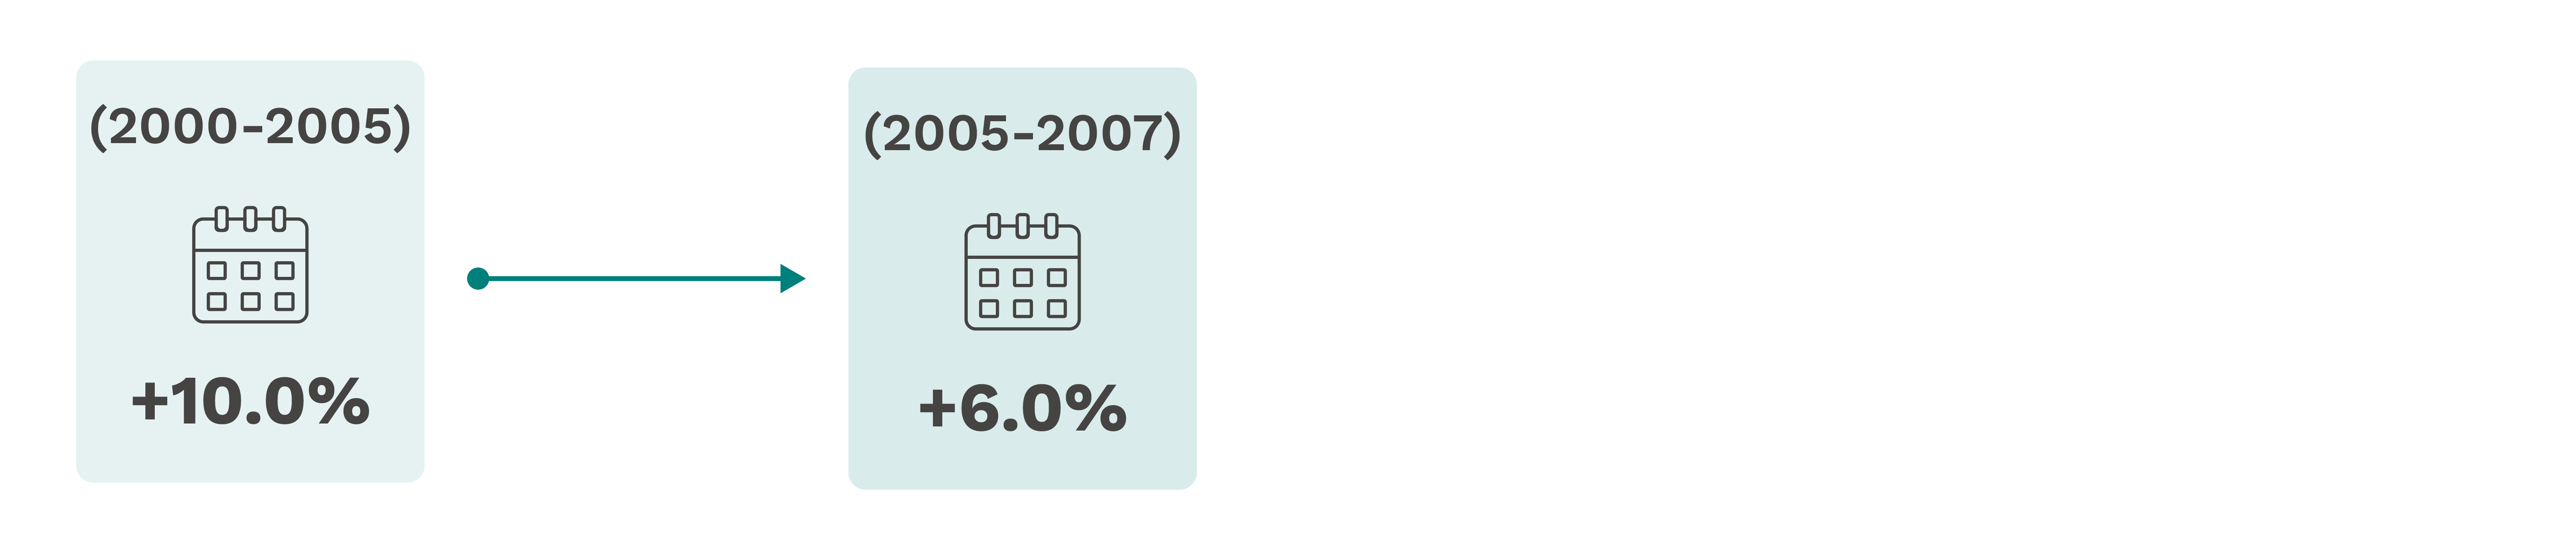
As the time periods are unequal, the figures above do not give a clear basis for comparison.
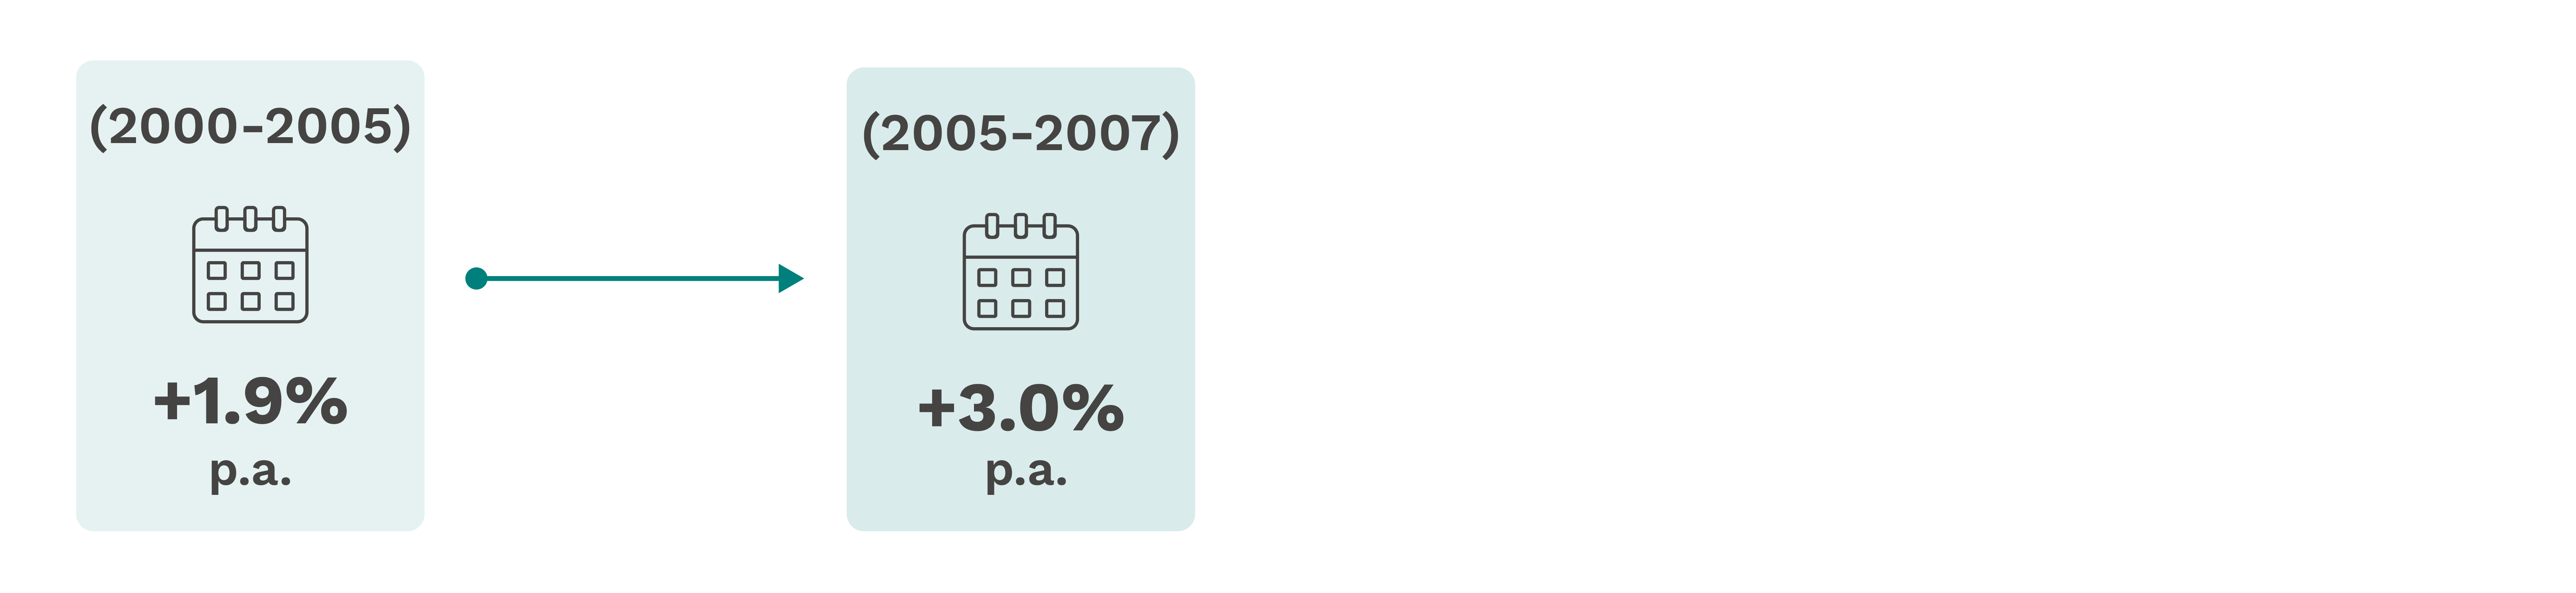
After computing the annualised wage growth for the two periods, it can be seen that Adam’s wage grew by an average of 1.9% per year from 2019 to 2024, and 3.0% per year from 2025 to 2026. The growth in Adam’s wages was faster in the later period from 2025 to 2026.
Limitations
Annualised growth rate is not the simple average of the growth rates for each year.
Referring to Example 1 above, we cannot compute the annualised growth by taking the simple average of the two growth rates (i.e. (10% + 20%)/2 = 15%).
This is because the 20% growth in 2025 was based on the value of 110 in 2024, rather than the initial value of 100 in 2023.
This is similar to the rules of compounding used to compute the returns of an investment or bank deposits, where the interest in year 1 is computed based on the principal amount in year 1, but interest in year 2 is computed based on the sum of the principal amount and interest earned in year 1.
Similarly, because of compounding, a wage growth of 10% over 5 years is equivalent to an annualised wage growth of 1.9% per year, rather than 10/5 = 2% per year.