Distribution
Understanding the concept of distribution, its uses and limitations
Last updated on 1 November 2026
Understanding distribution
In studying labour market indicators, we are often interested in knowing the profile of a group in terms of different characteristics. For example,
Distribution of residents in the labour force by sex
Distribution of employed residents by age
Distribution of unemployed residents by educational attainment
Distribution of job vacancies by industry
Distribution of workers made redundant by occupation
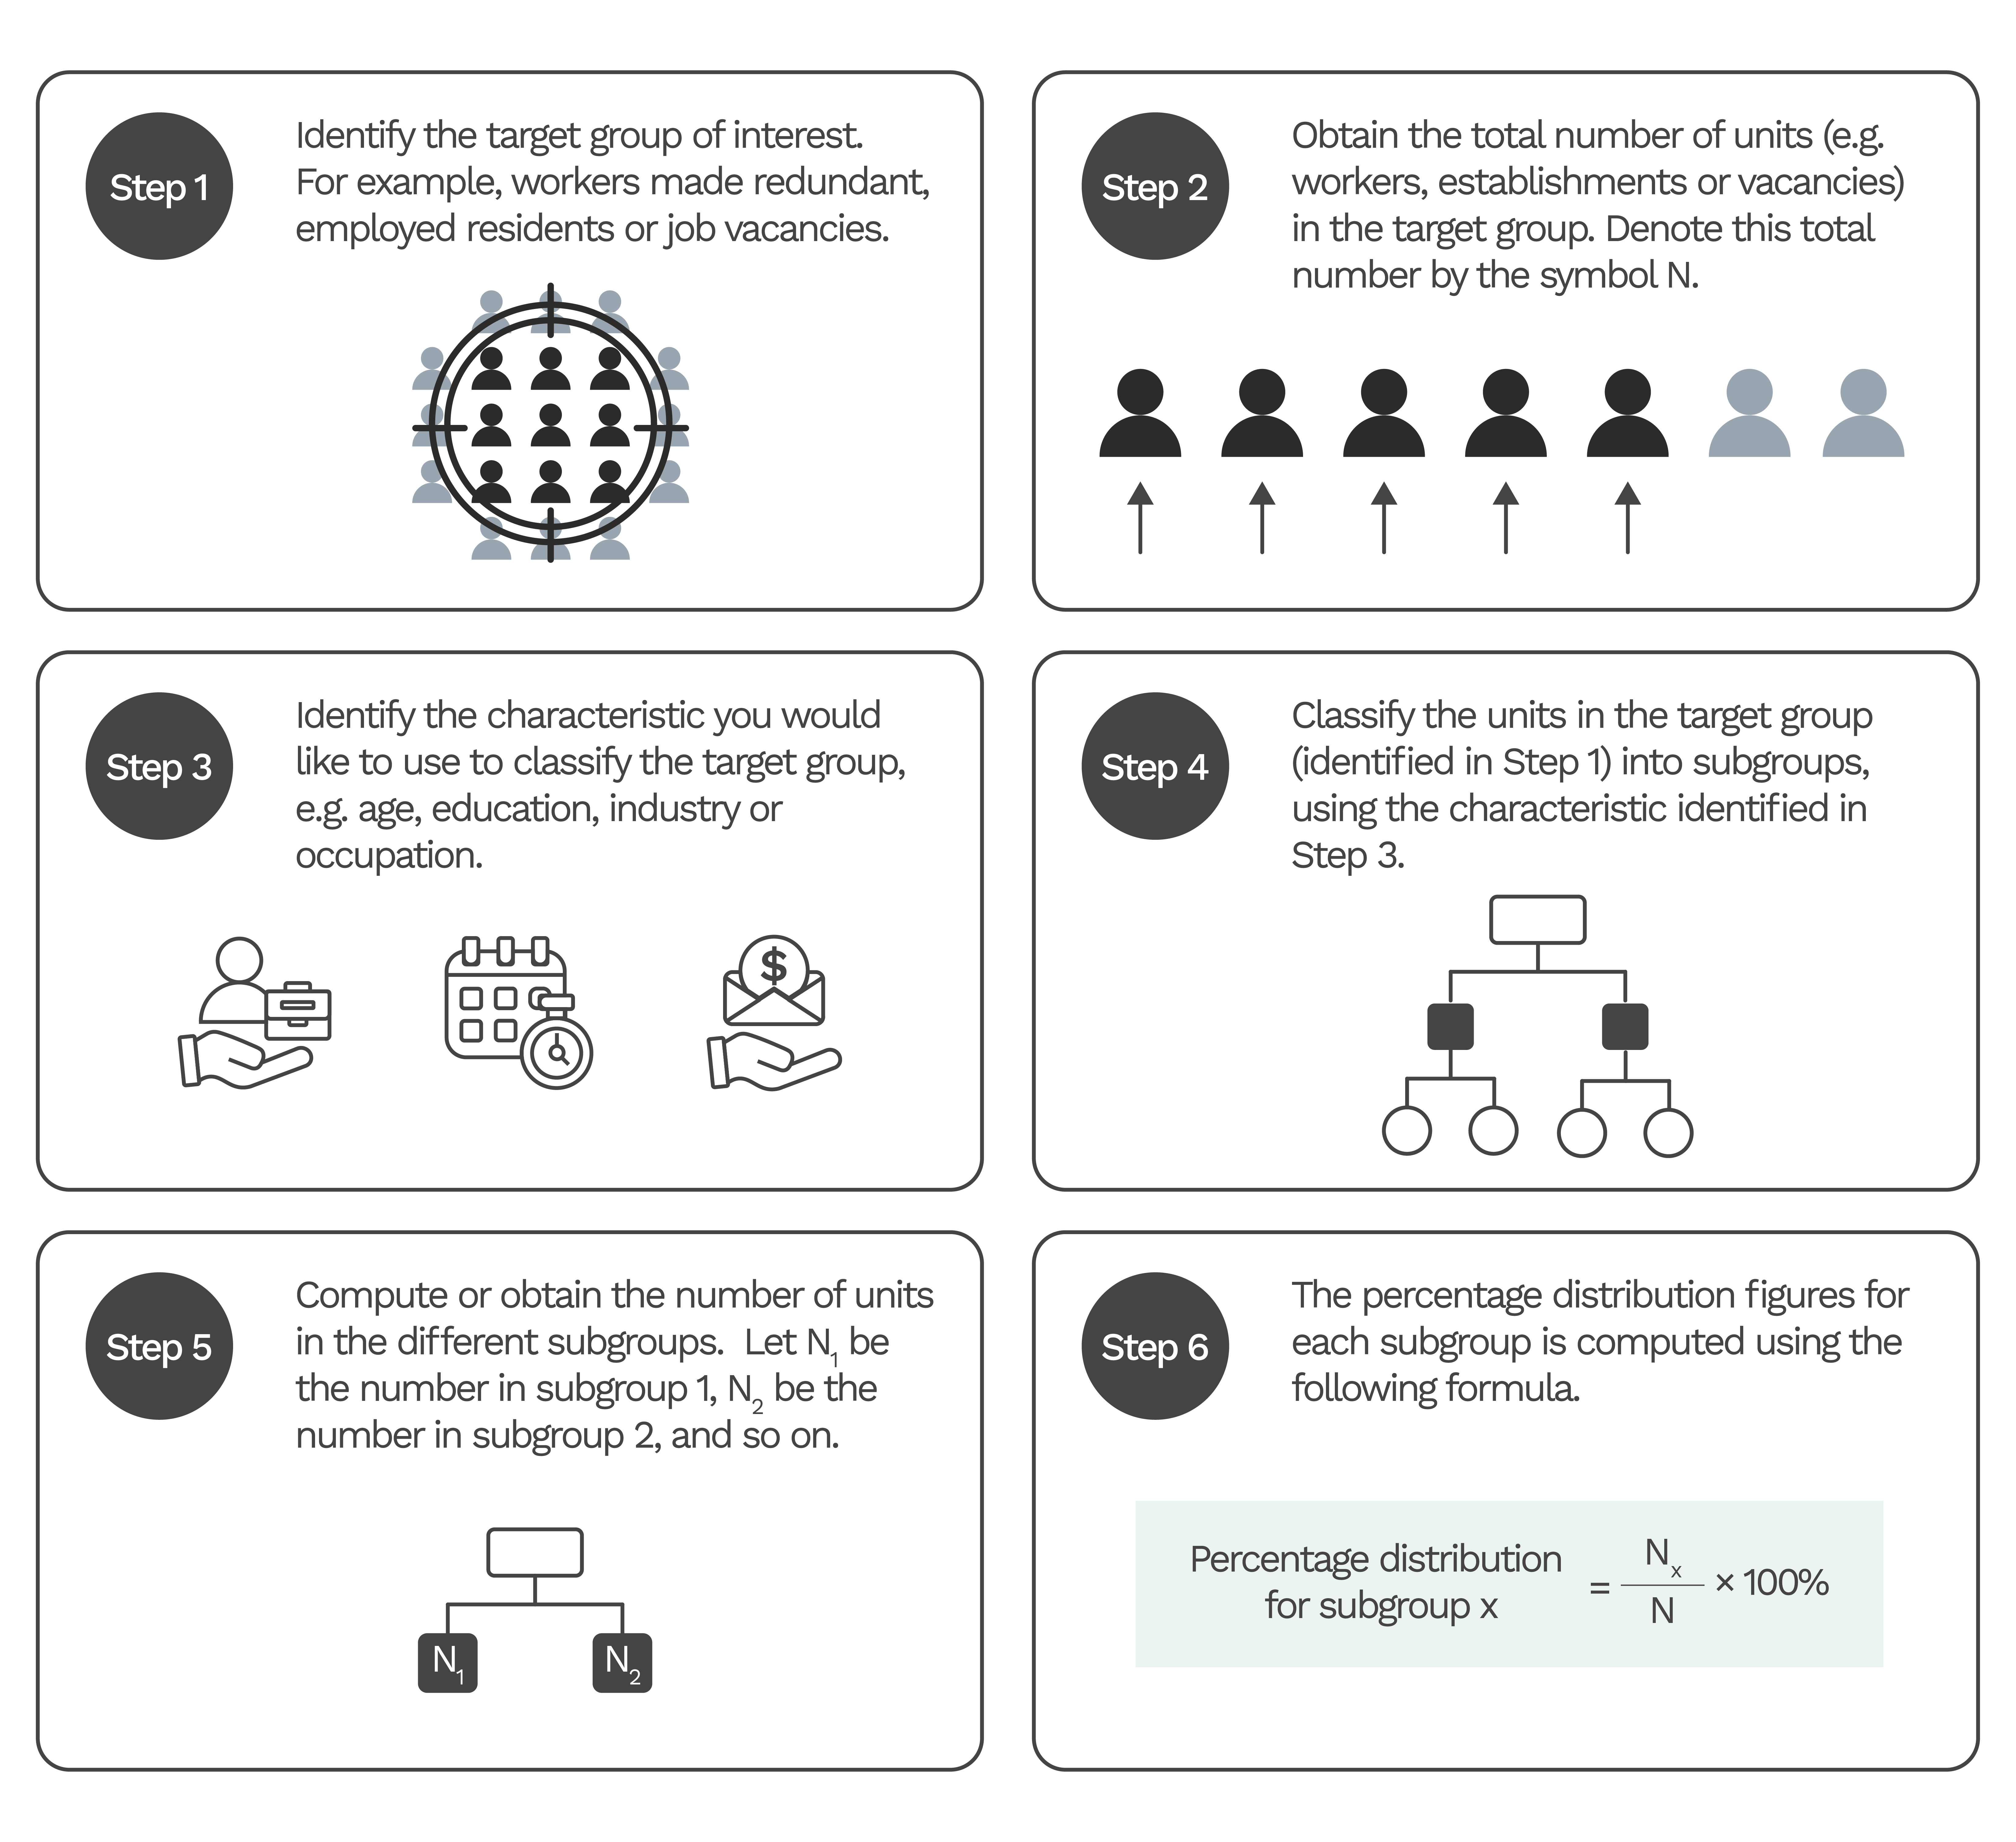
Distribution data shows how a group can be classified into subgroups based on different characteristics. It expresses the number of units in the subgroup as a percentage of the total number of units in the group being considered.
Computing percentage distribution
Example 1
Suppose you want to find out the sex distribution of residents in the labour force in Singapore.
In this case,
the target group is resident labour force in Singapore,
and the characteristic used in the classification is sex.
The number of residents in the labour force in Singapore in June 2010 are as follows
Total: 2,047,300
Males: 1,151,600
Females: 895,700
The percentage distribution figures are computed as follows:
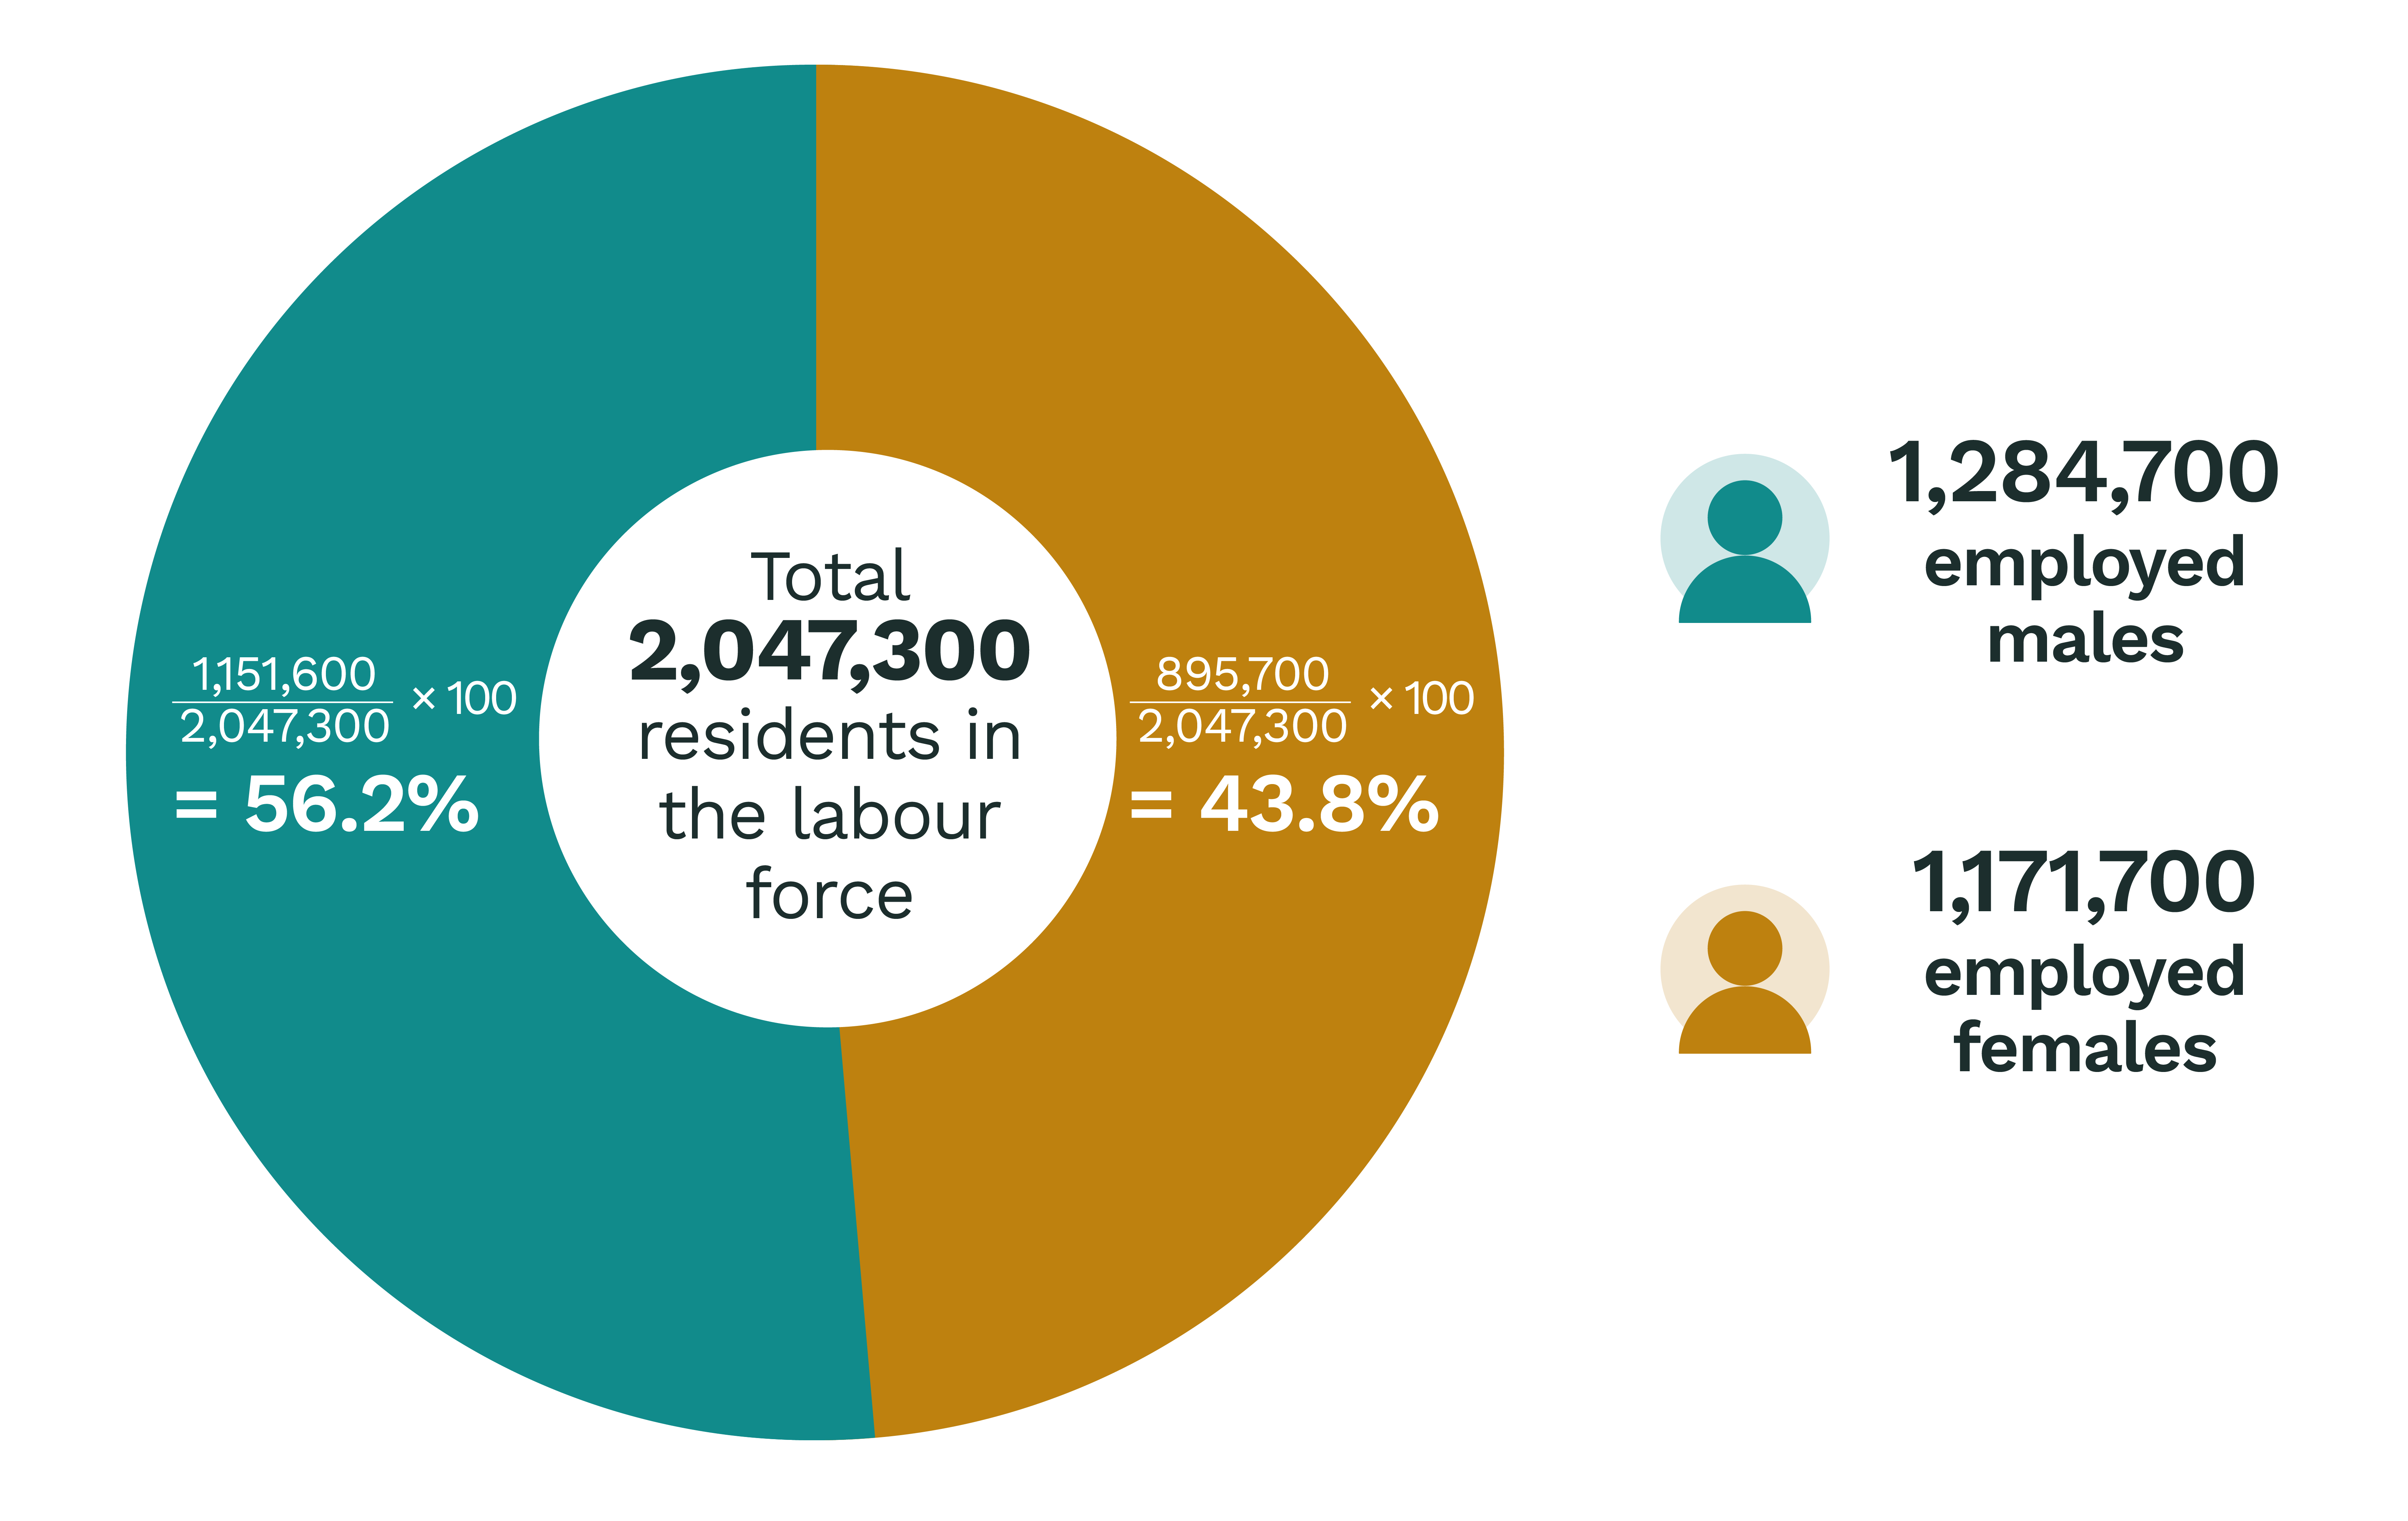
That is, of the 2,047,300 residents in Singapore's labour force in 2010, 56.2% were males and 43.8% were females.
Example 2
Suppose you would like to know the educational profile of unemployed residents in Singapore in June 2010.
In this case
the target group is unemployed residents in Singapore,
and the characteristic used in the classification is educational attainment (also known as highest qualification attained).
The number of unemployed residents in Singapore in June 2010 are as follows:
Total: 84,400
Below Secondary: 20,600
Secondary: 17,200
Post-Secondary (Non-Tertiary): 11,500
Diploma & Professional Qualification: 14,300
Degree: 20,800
The percentage distribution figures are computed as follows:
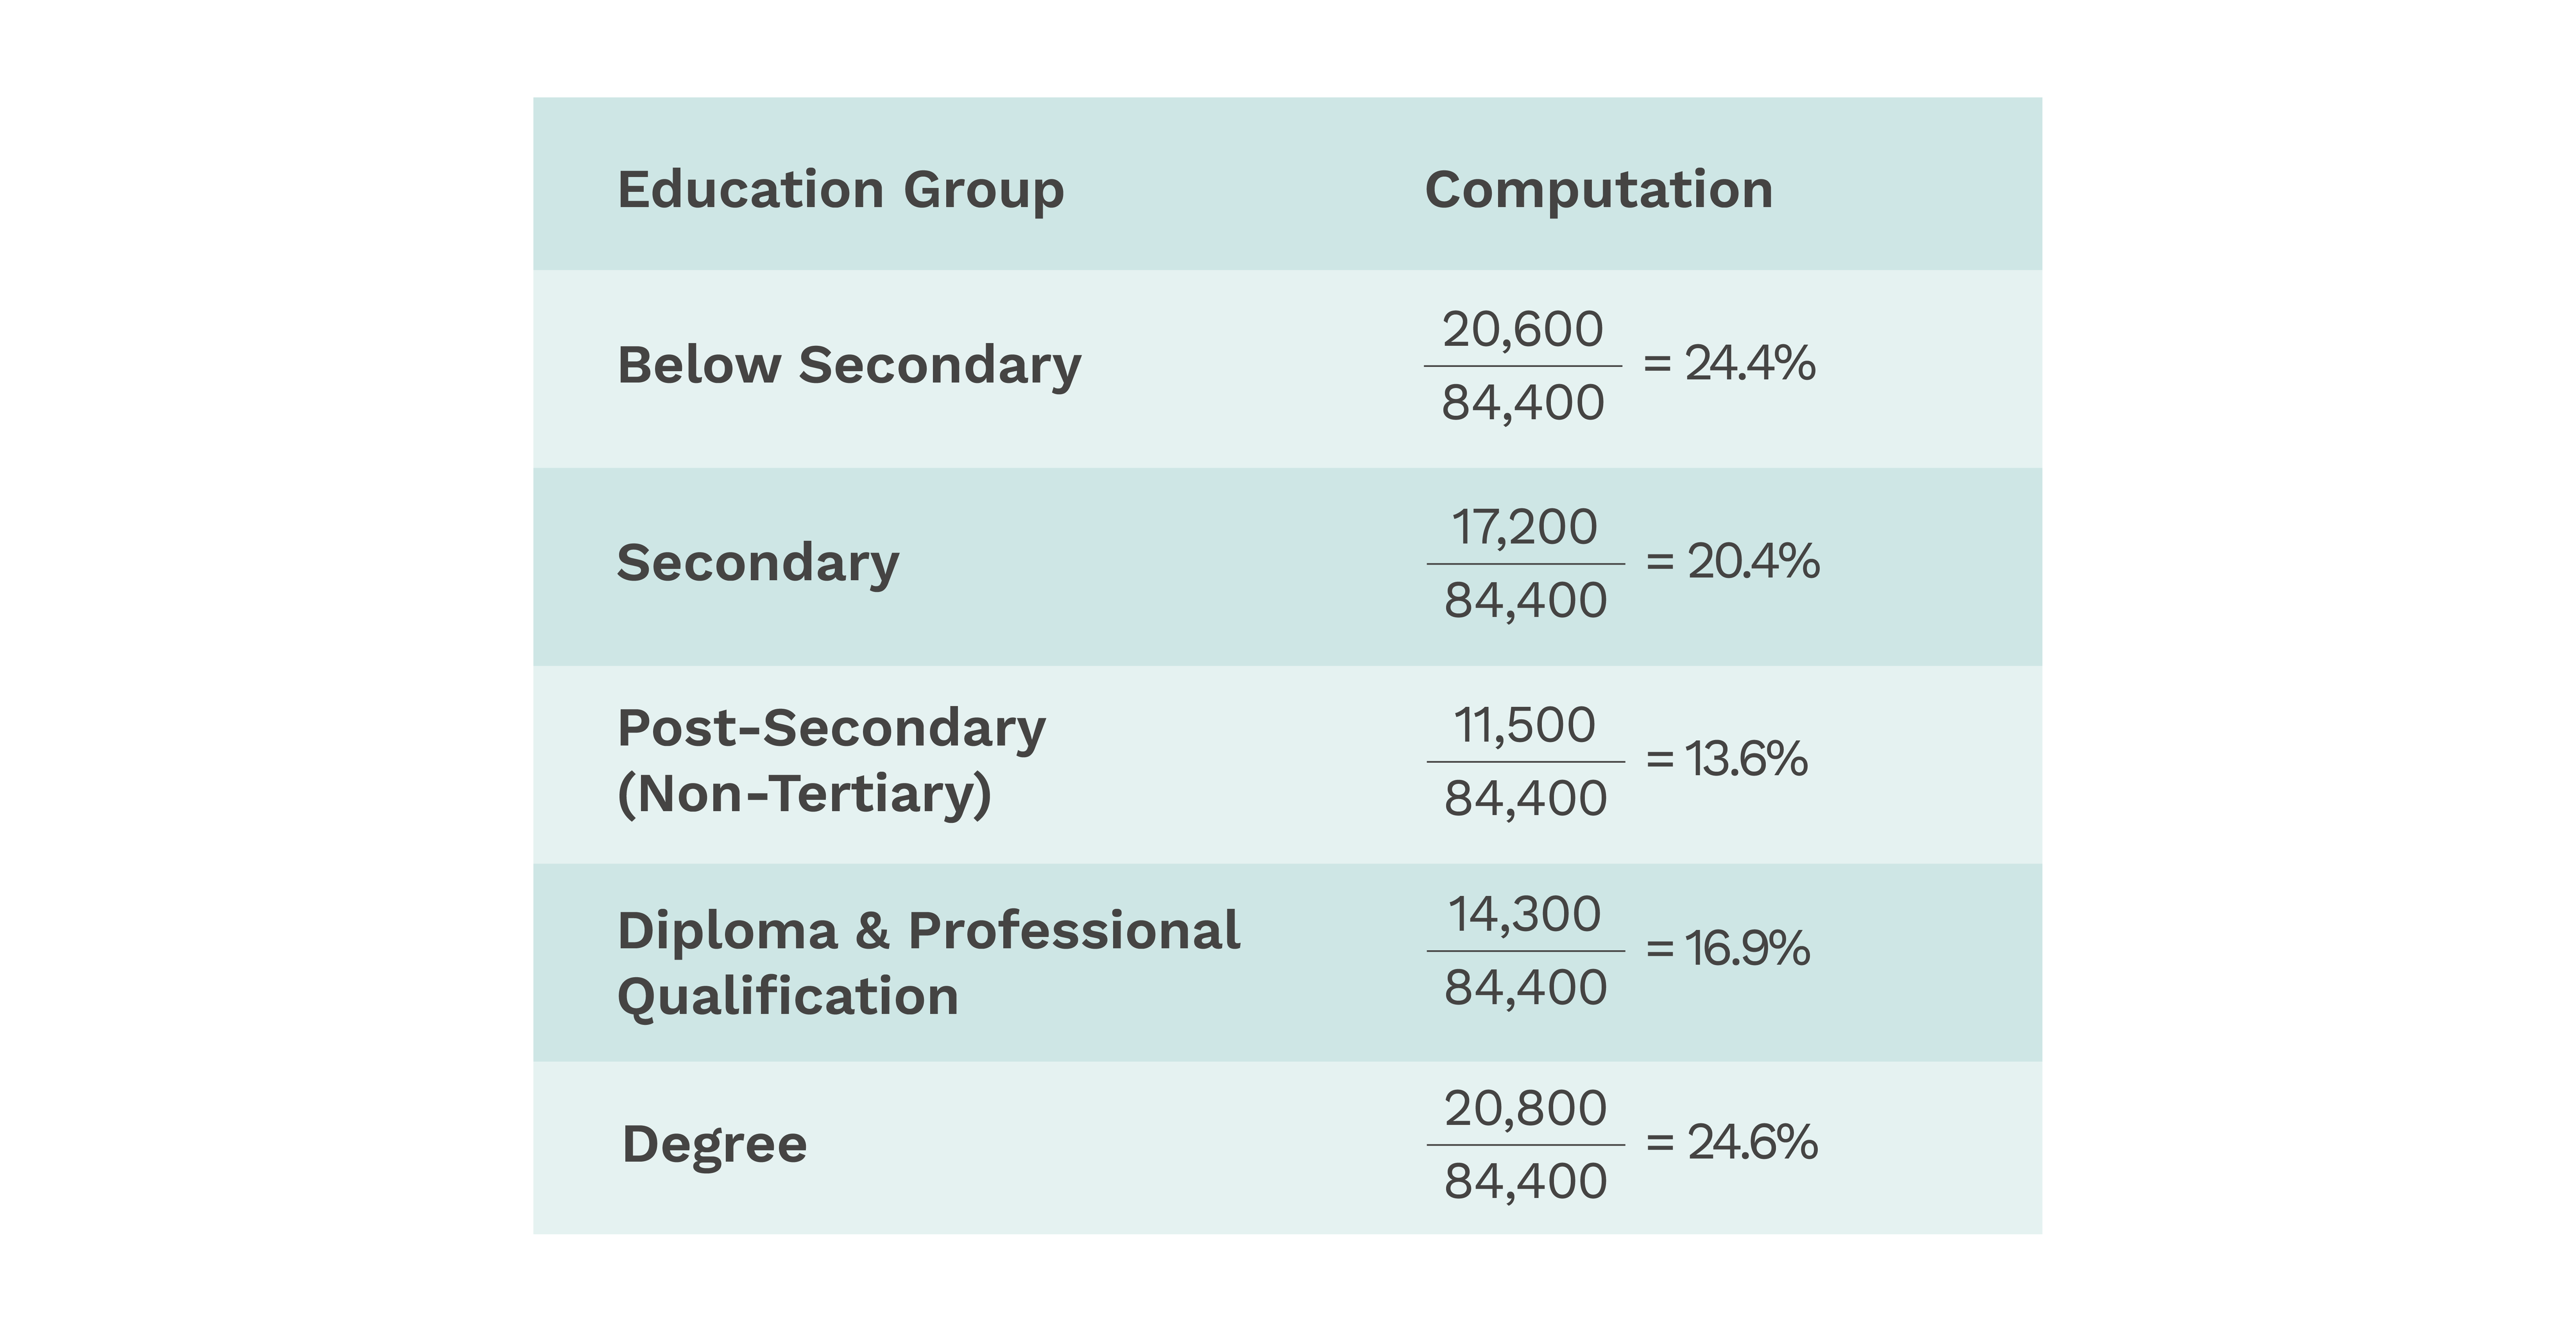
Of the 84,400 unemployed residents in Singapore in June 2010,
24.4% were below-secondary educated,
20.4% had secondary education,
13.6% were from the post-secondary (non-tertiary) group,
16.9% had diploma/professional qualifications and
24.6% were degree holders.
*Percentages do not add up to a hundred as they are rounded to 1 decimal place.
Uses of distribution
Percentage distribution helps us better understand the profile of a target group.
For example, the distribution of unemployed residents by educational attainment can help employment agencies better customise their services, such as sourcing job openings that match the education profile of unemployed residents and designing skills training programmes aligned with job seekers’ qualification levels.
Percentage distribution figures facilitate the comparison of the profile of different groups.
For example:
comparing the age profile of the labour force in a big country with that in a small country
comparing changes in the occupational profile of employed persons over time
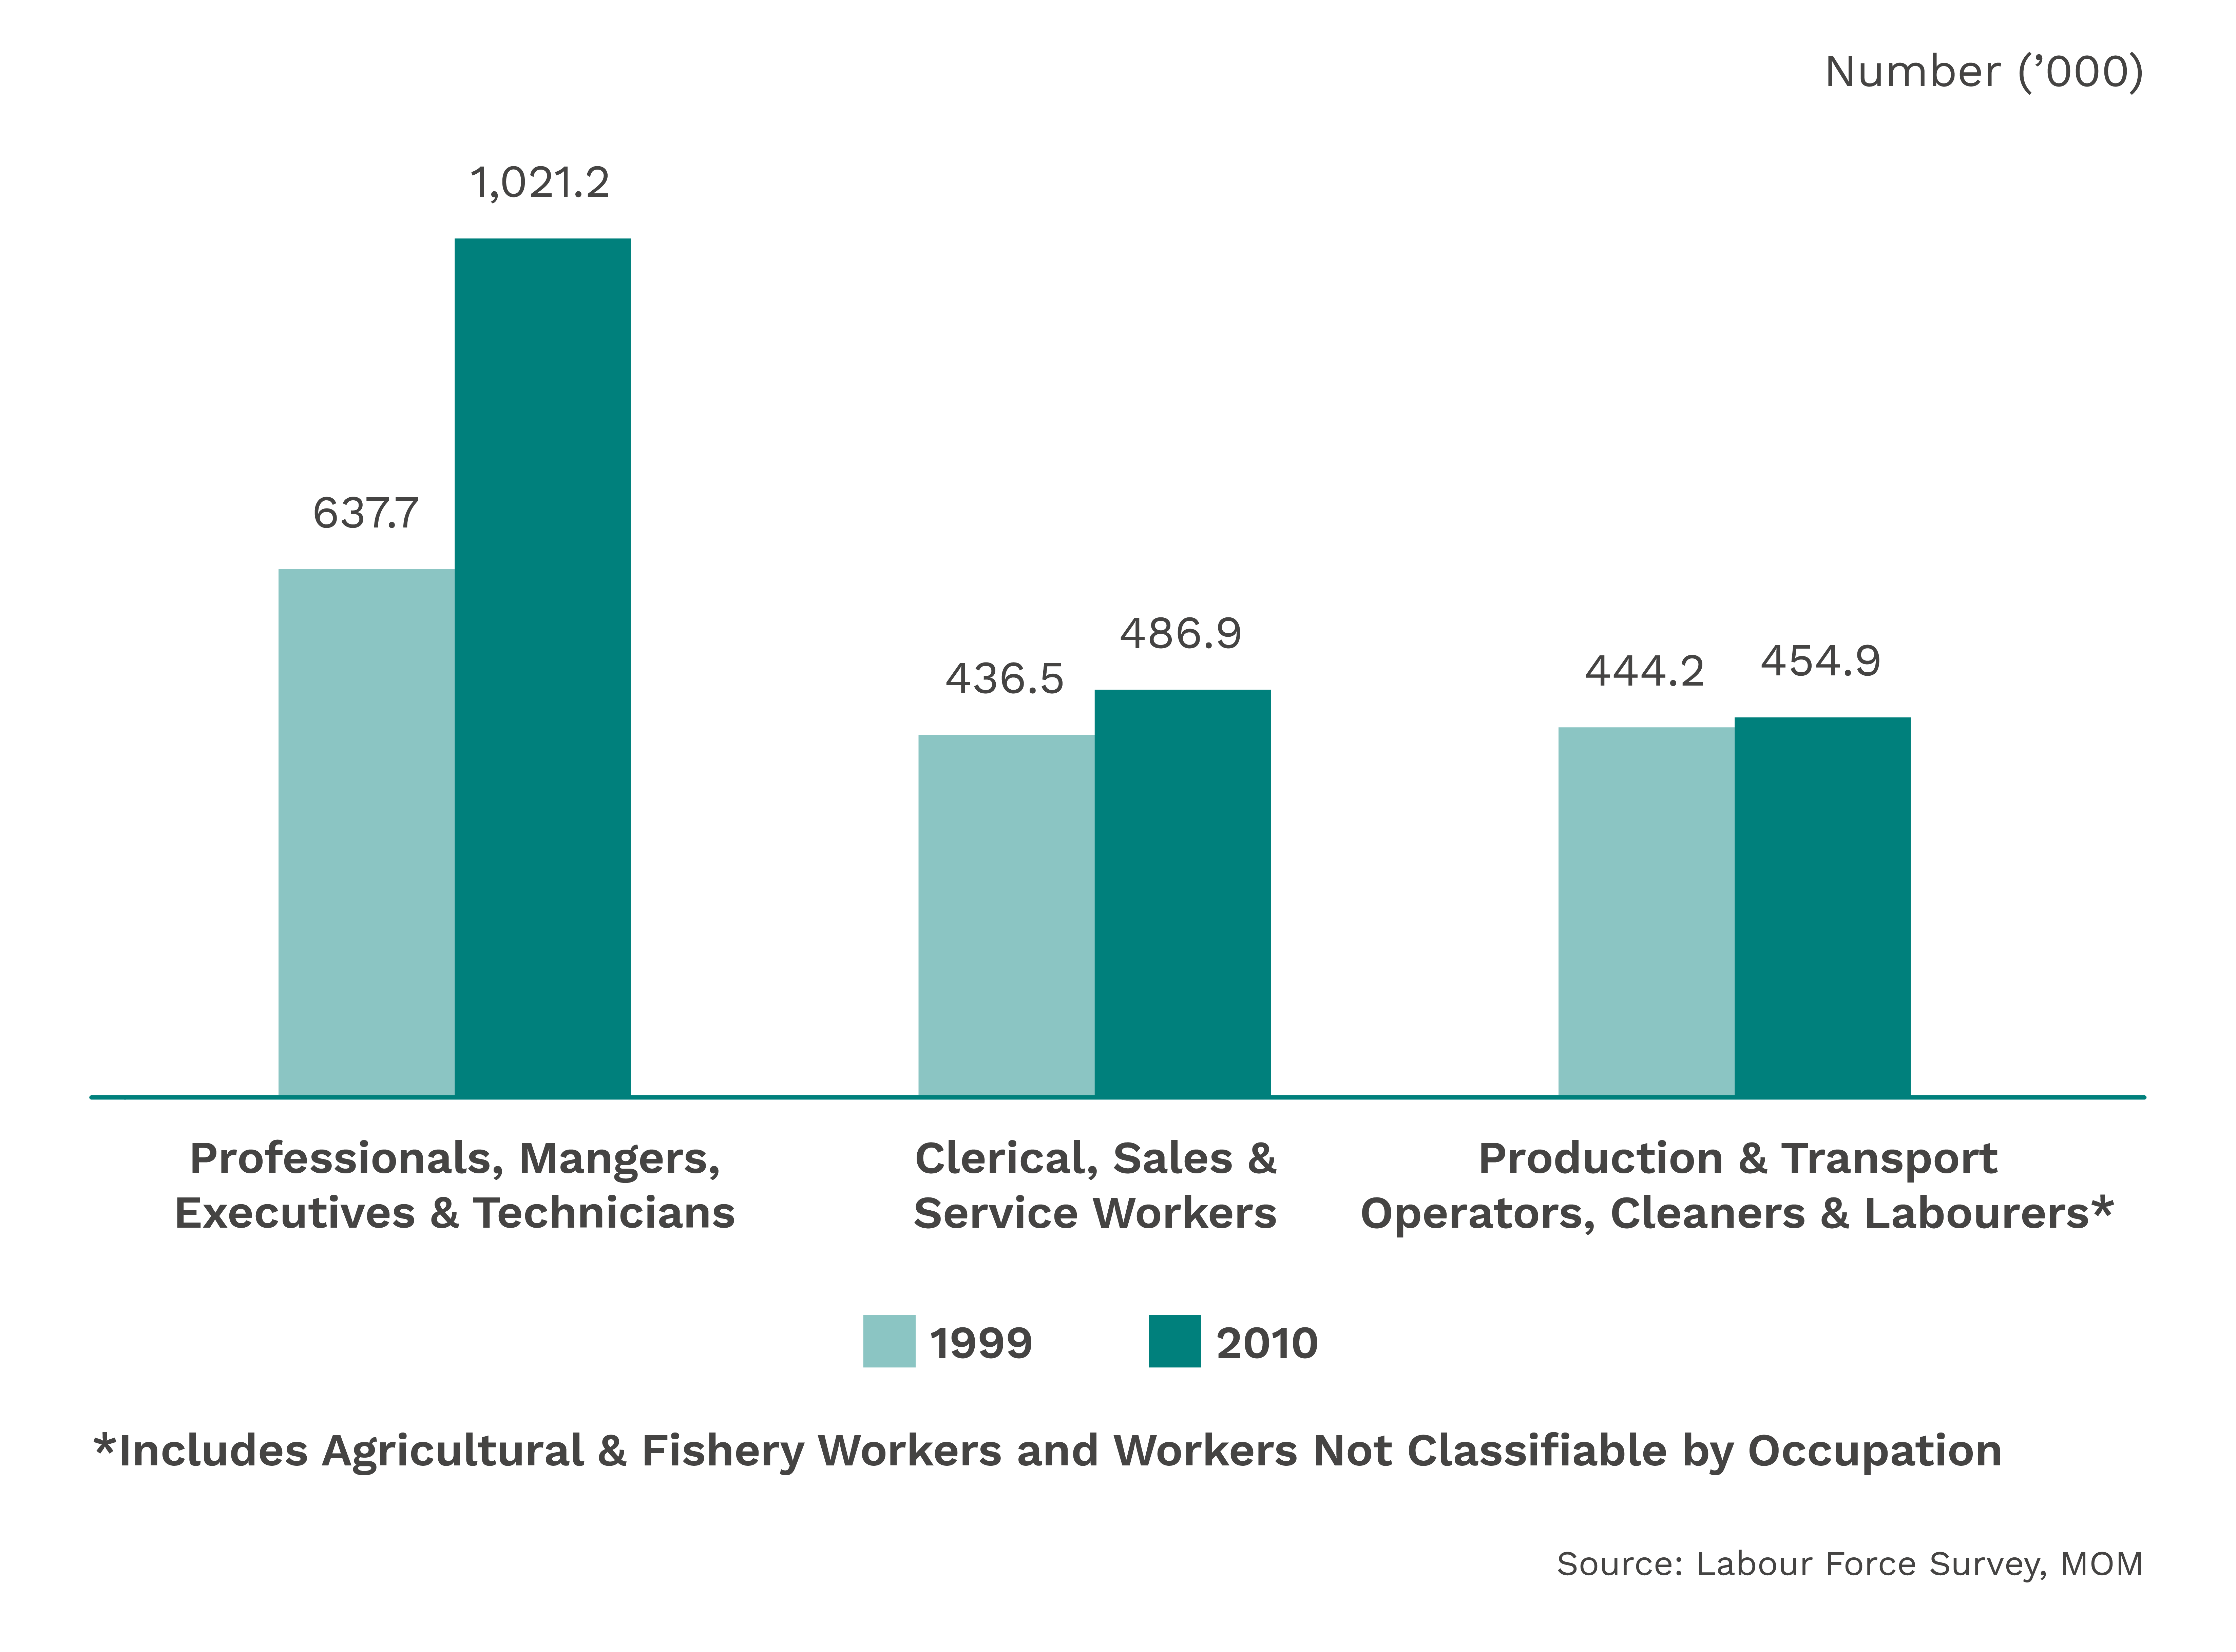
To illustrate the second point above, suppose we are interested in understanding how the distribution of employed residents by occupation has changed from 1999 to 2010.
Number of Employed Residents by Occupation, 1999 and 2010 (June)
Reflecting population growth, there were more employed residents in all three broad occupational groups in 2010 than in 1999. However, this by itself may not clearly show how the occupational profile of Singapore's employed pool has changed.
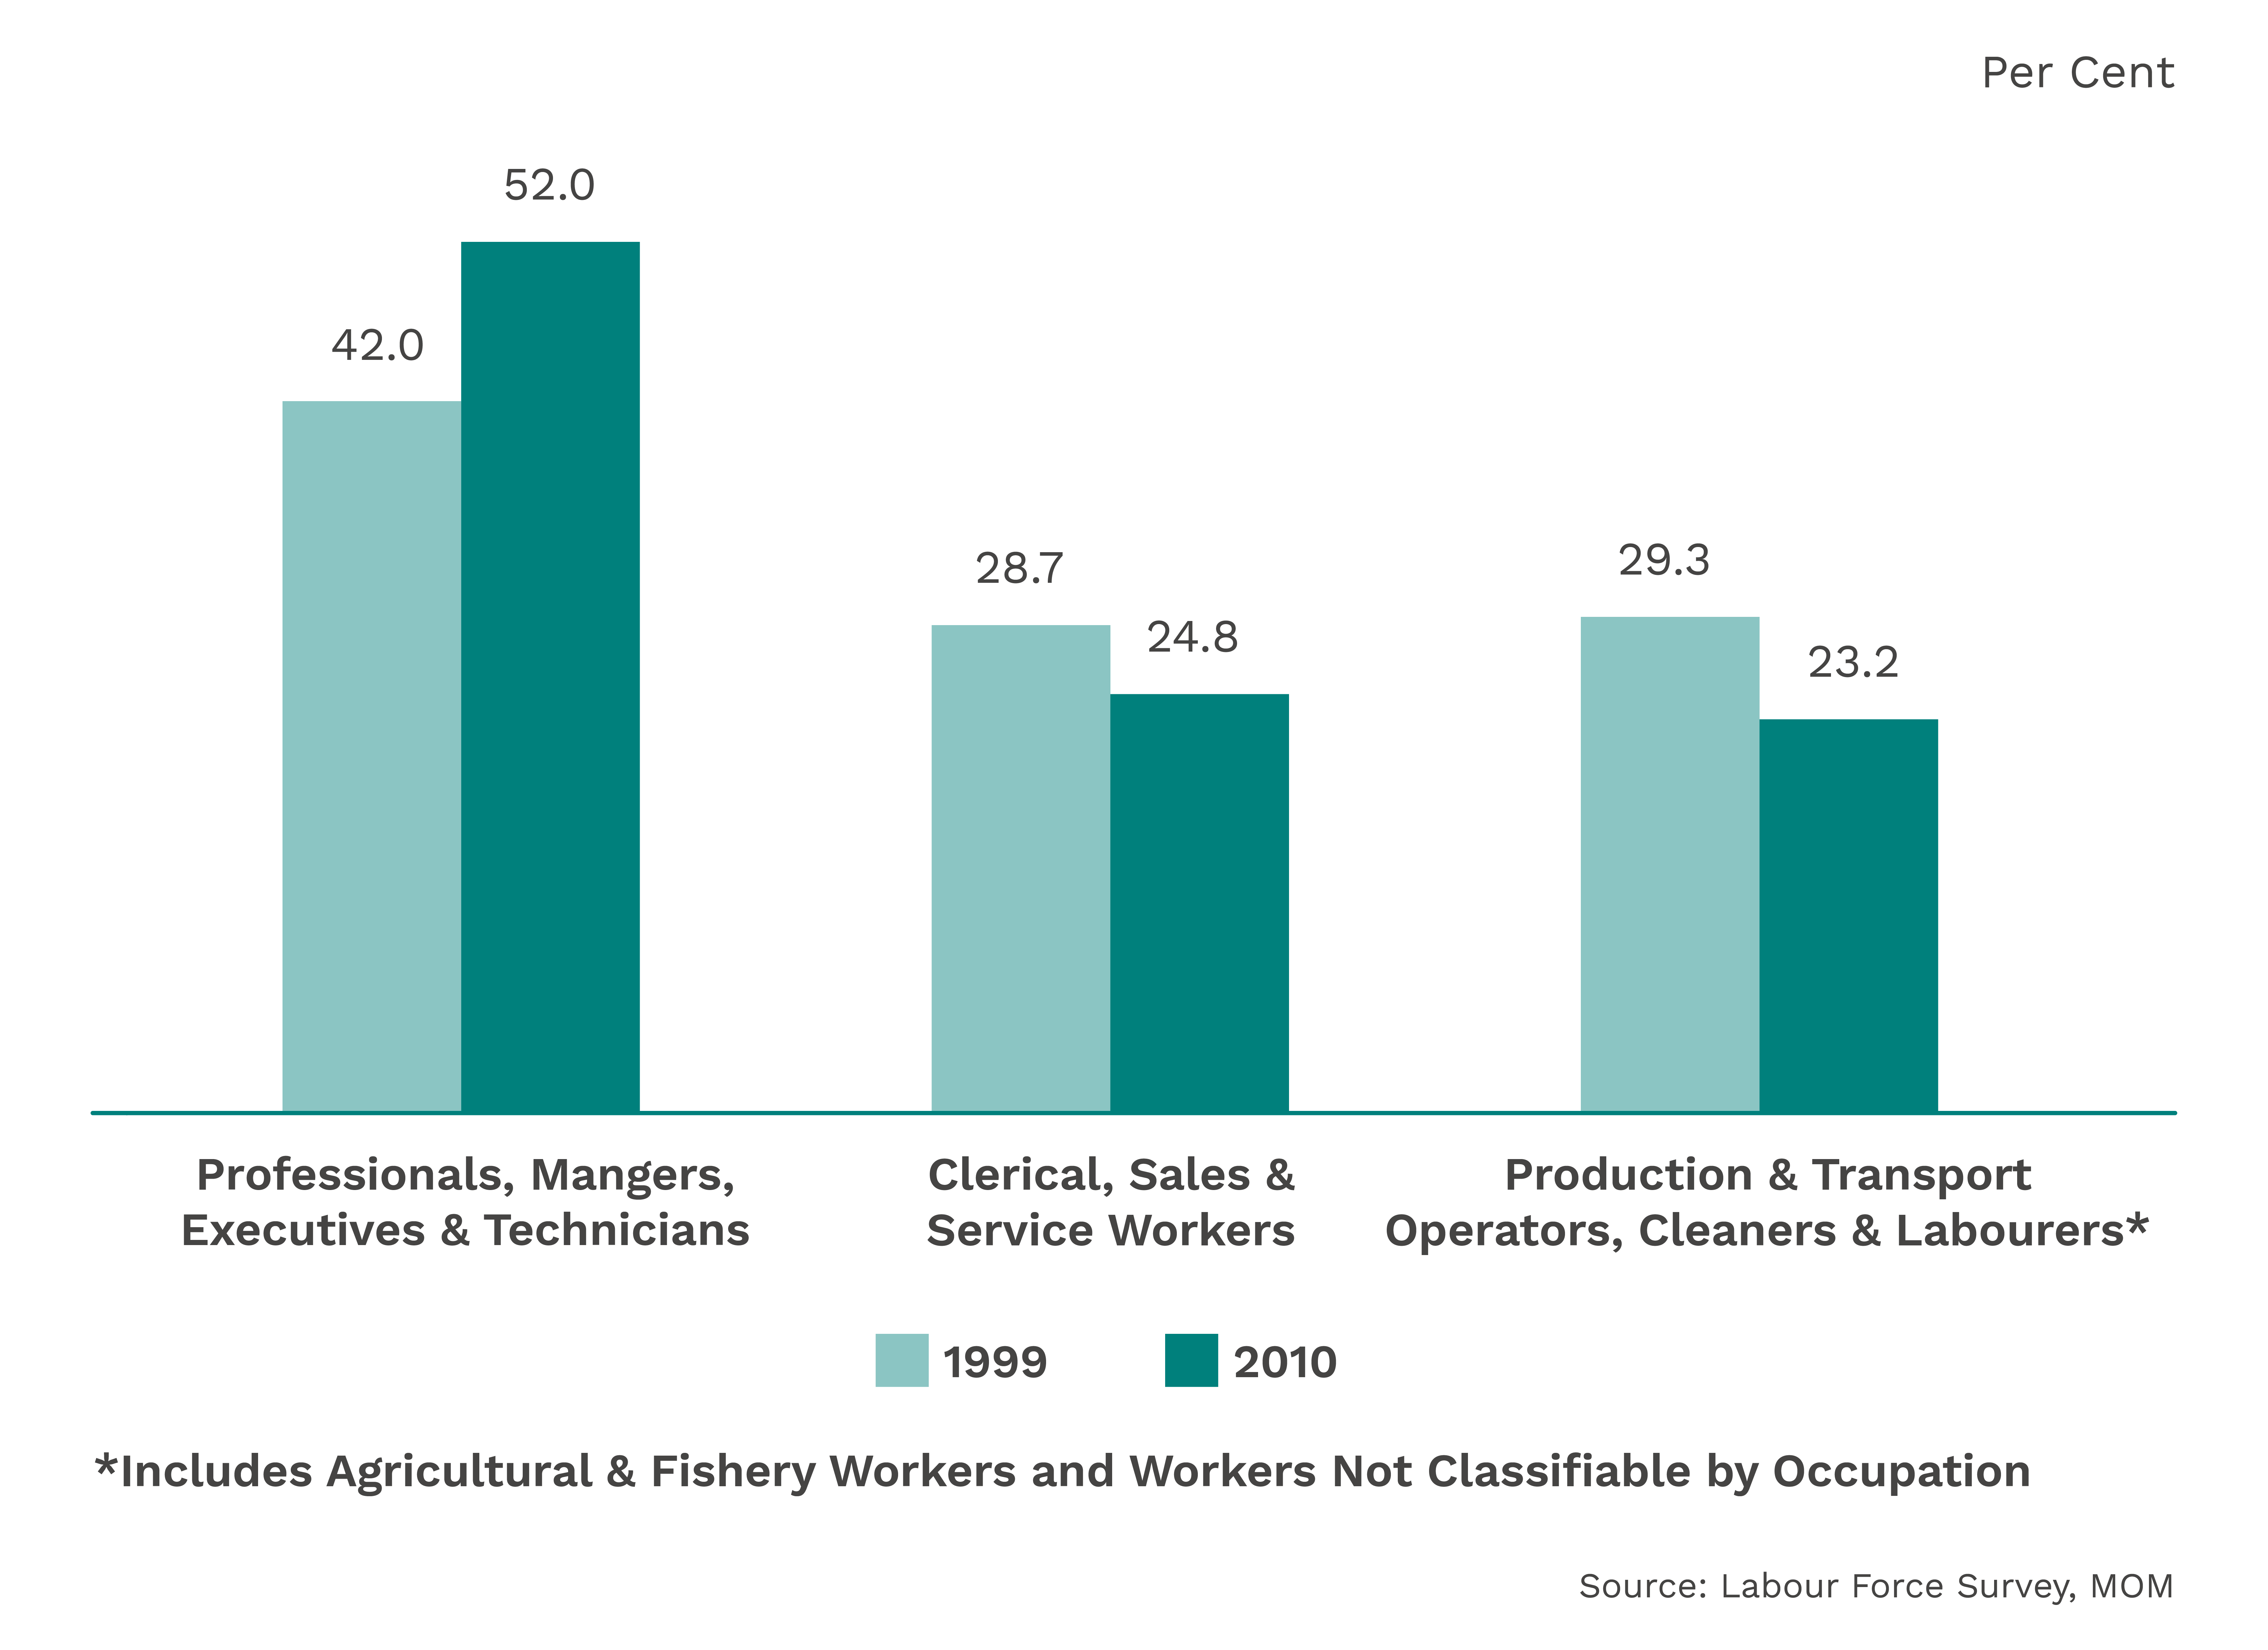
The percentage distribution of employed residents by occupation shows a shift in the occupational profile towards higher-skilled professional, managerial, executive & technician (PMET) jobs, as the share of employed residents in this occupational group has increased while that for the other two groups have decreased.
Limitations
Distribution of Employed Residents by Occupation, 1999 and 2010 (June)
Percentage distribution data does not necessarily indicate whether one group is more vulnerable to a particular outcome (e.g., unemployment) than others.
In Example 2 earlier, degree holders made up the largest group among unemployed residents. However, this does not necessarily mean that degree holders are the most vulnerable to unemployment.
The high proportion of degree holders among unemployed residents merely reflects their high proportion in the resident labour force.
Distribution of Resident Labour Force and Unemployed Residents by Educational Attainment, June 2010
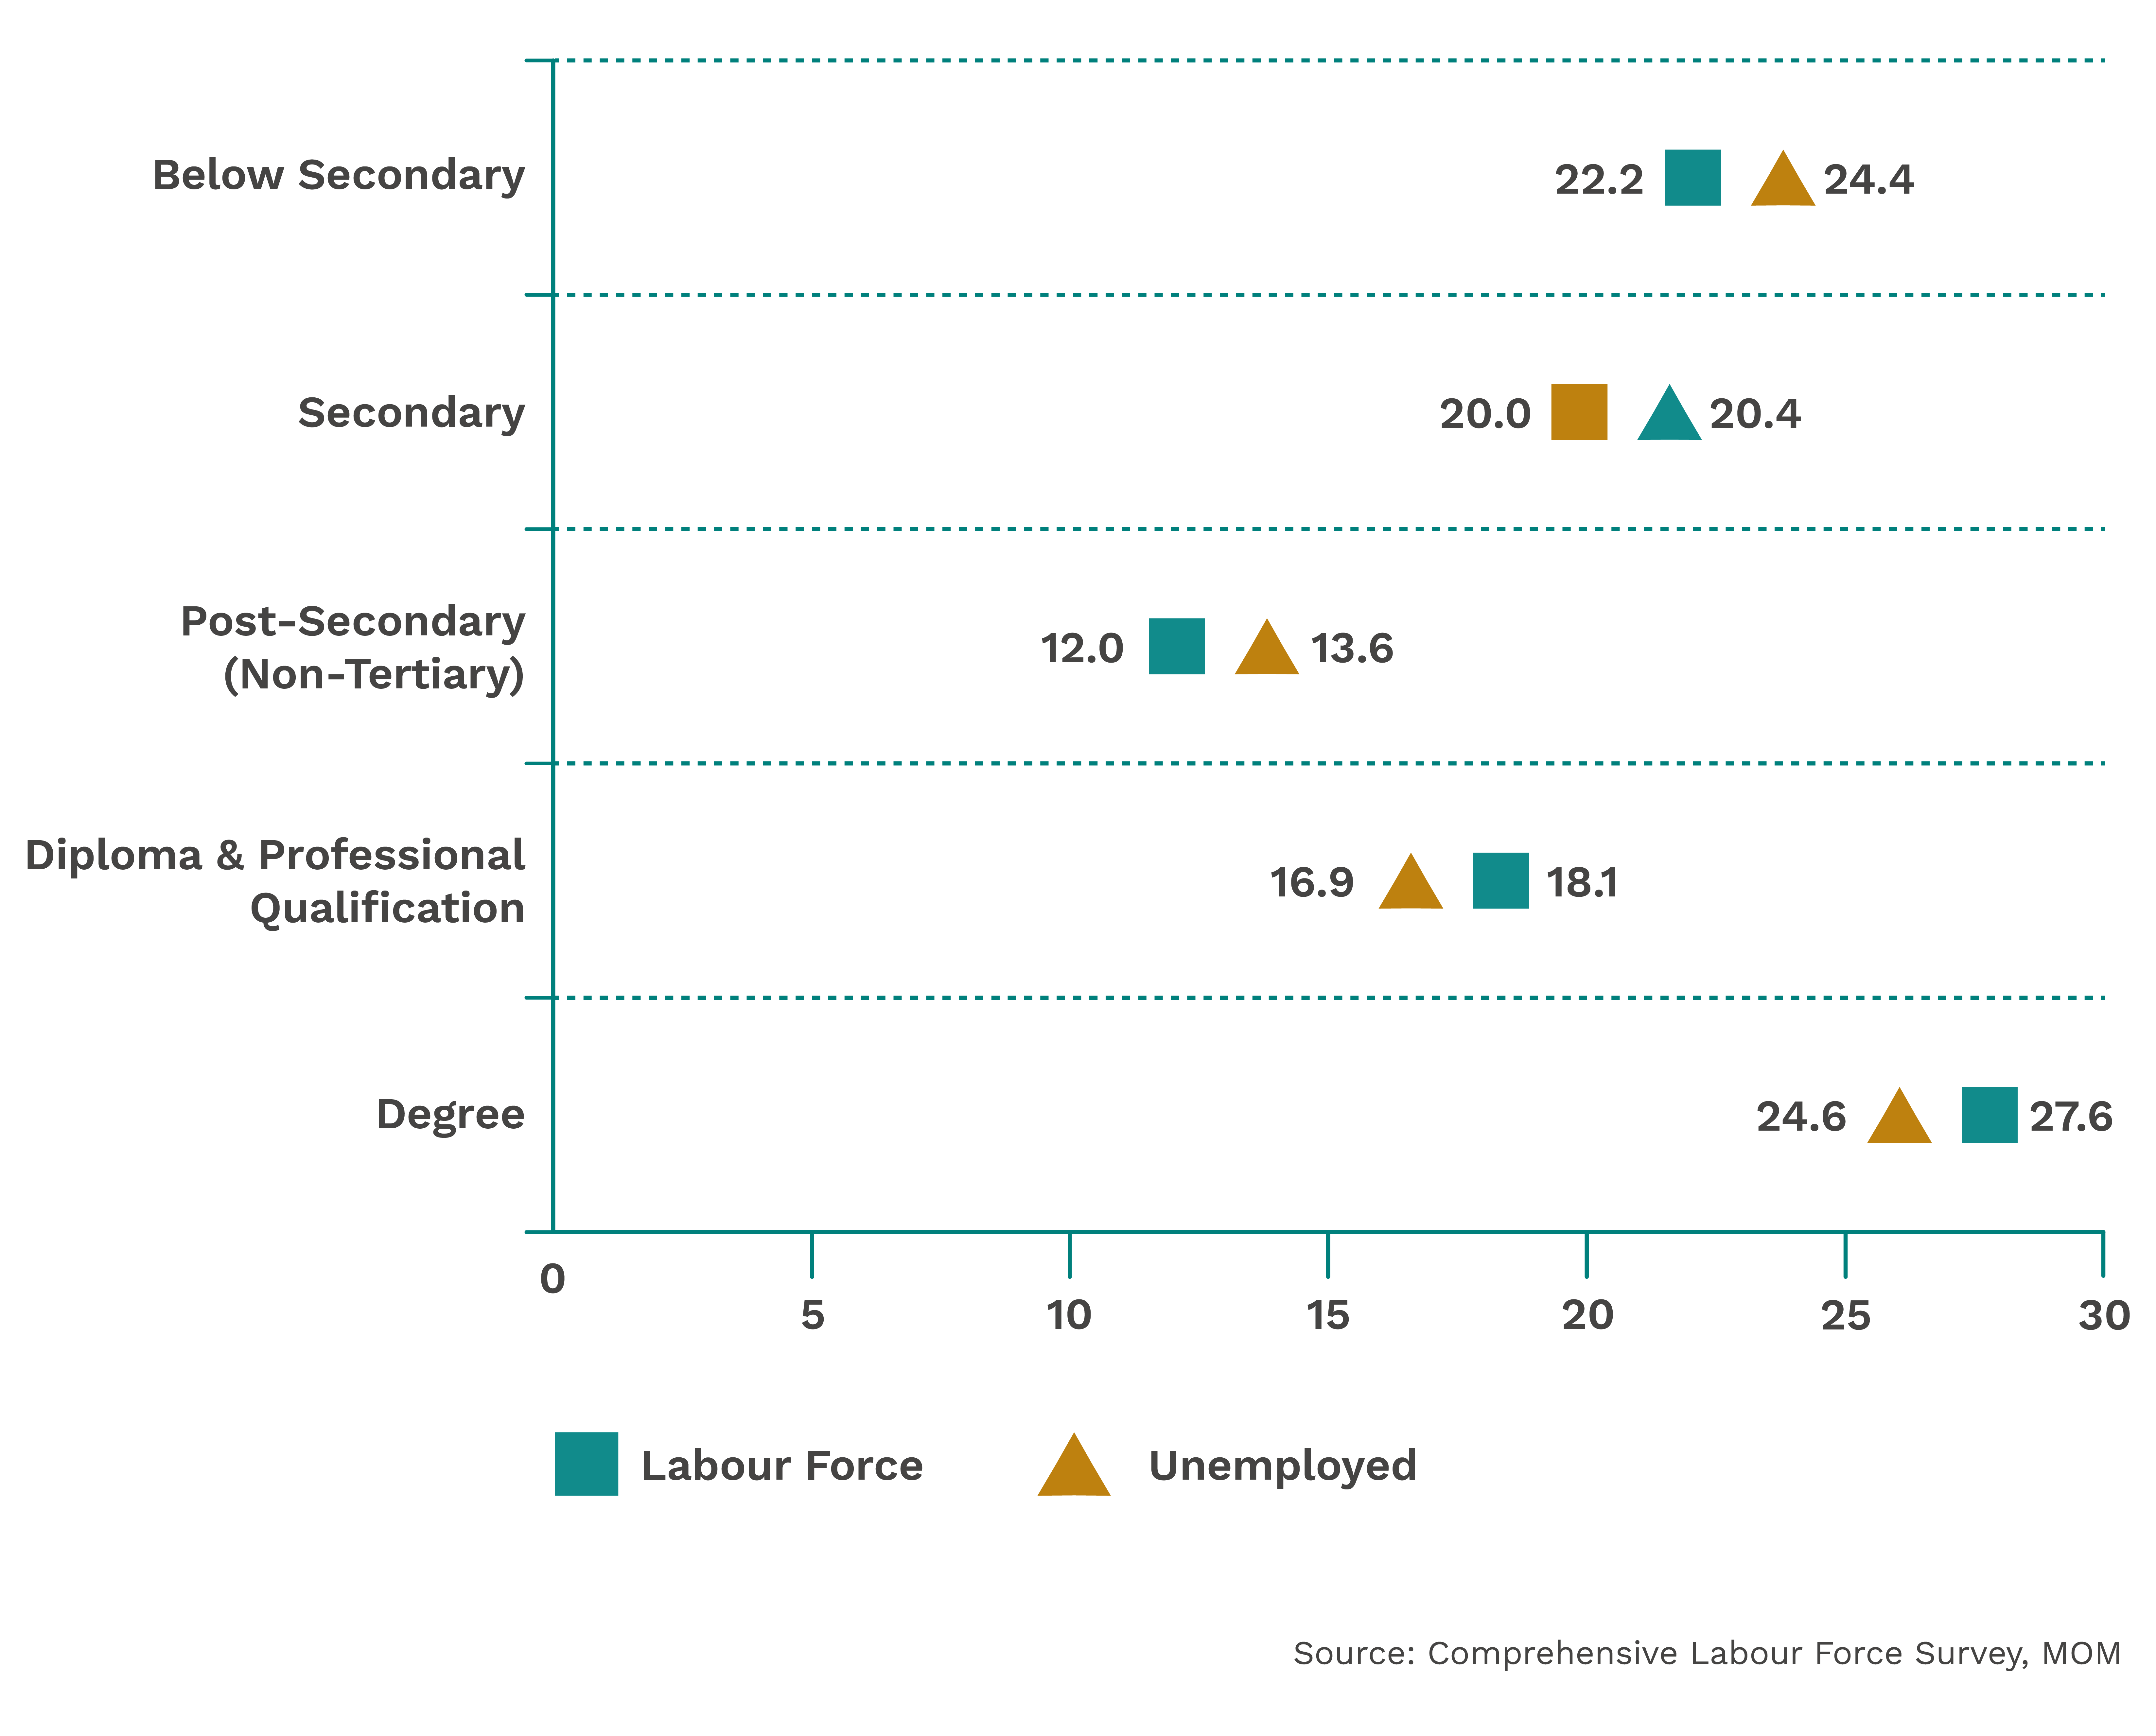
To compare the vulnerability of unemployment across different education groups, it would be more appropriate to use the concept of incidence rather than distribution.
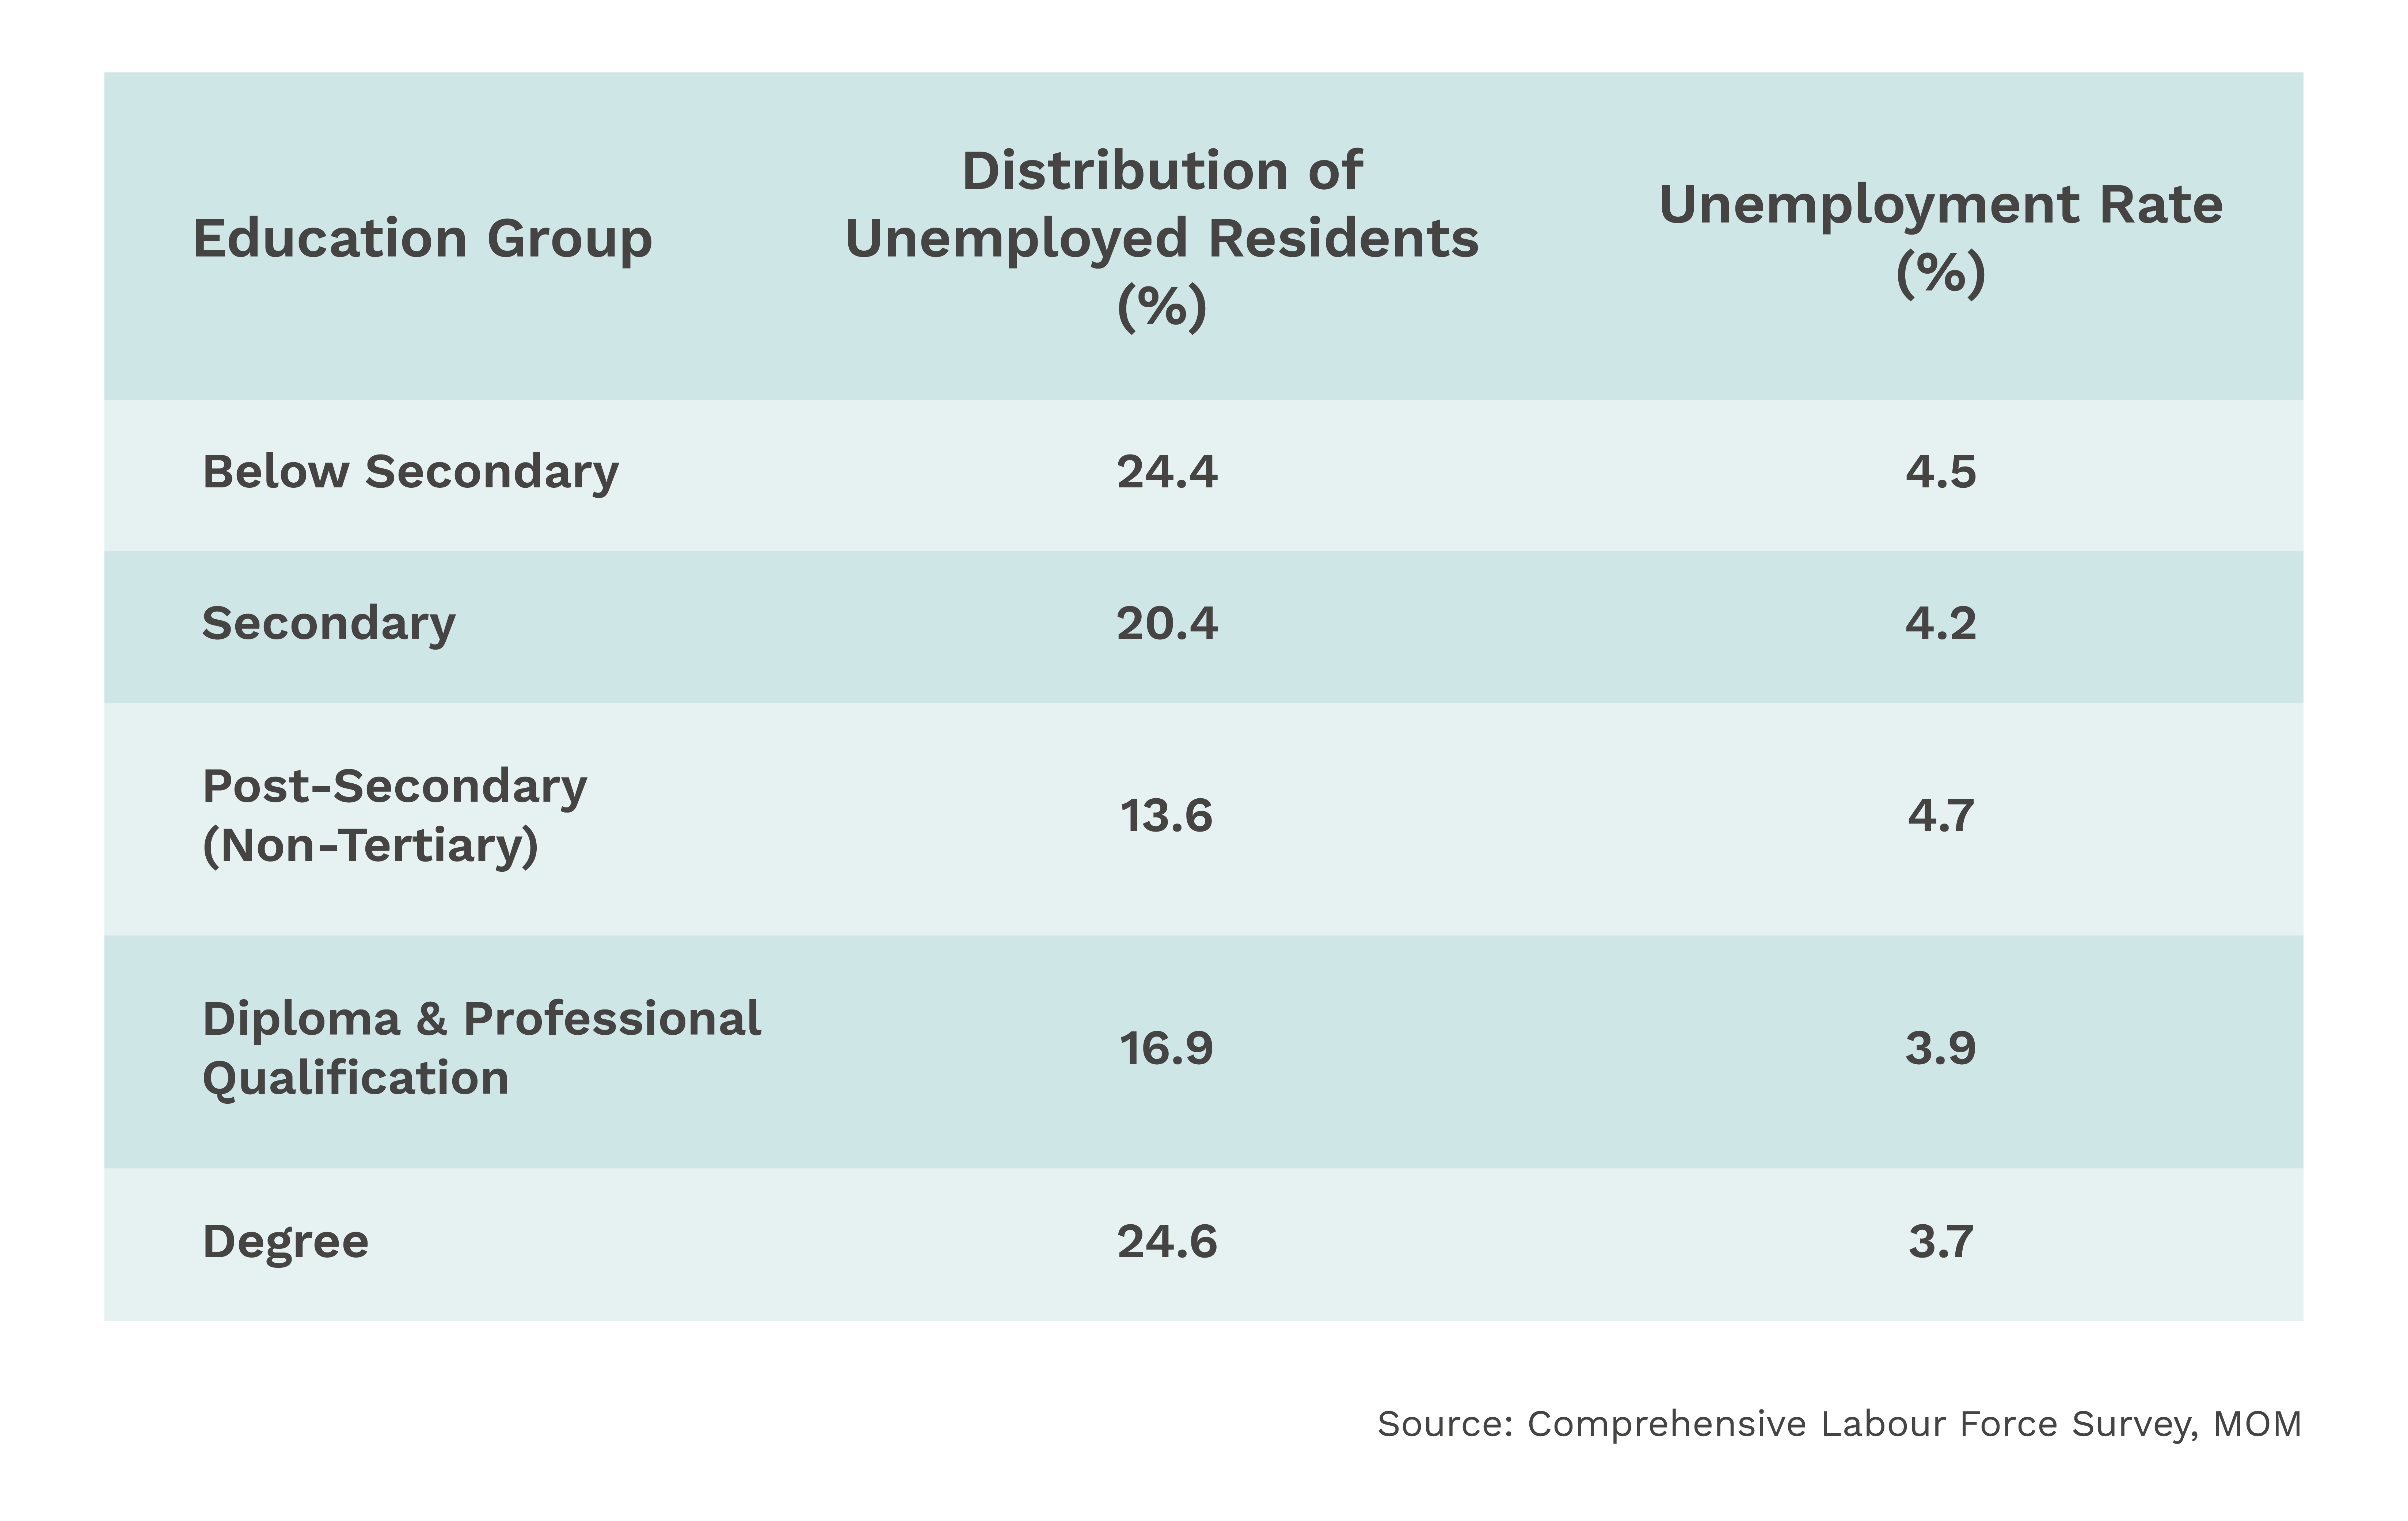
For unemployment, the incidence measure is the unemployment rate, which expresses the number of unemployed in each education group to the labour force (employed plus unemployed) in the same education group. This normalises the number of unemployed persons in the various education groups against their different labour force sizes. As shown in the table below, degree holders in fact had the lowest unemployment rate among the education groups. Hence, they were least vulnerable to being unemployed in June 2010.
Unemployment Indicators by Educational Attainment, 2010