
Percentages
Understanding the concept of percentages, their uses and limitations
Last updated on 1 November 2026
Understanding percentages
Percentages are one of the commonly used statistics. They can be found in rates such as the unemployment rate, employment rate, as well as discounts in stores.
“Per cent” means “out of every 100”. Percentage figures are derived by dividing one quantity by another, with the latter rebased to 100. Percentages are symbolised by %.
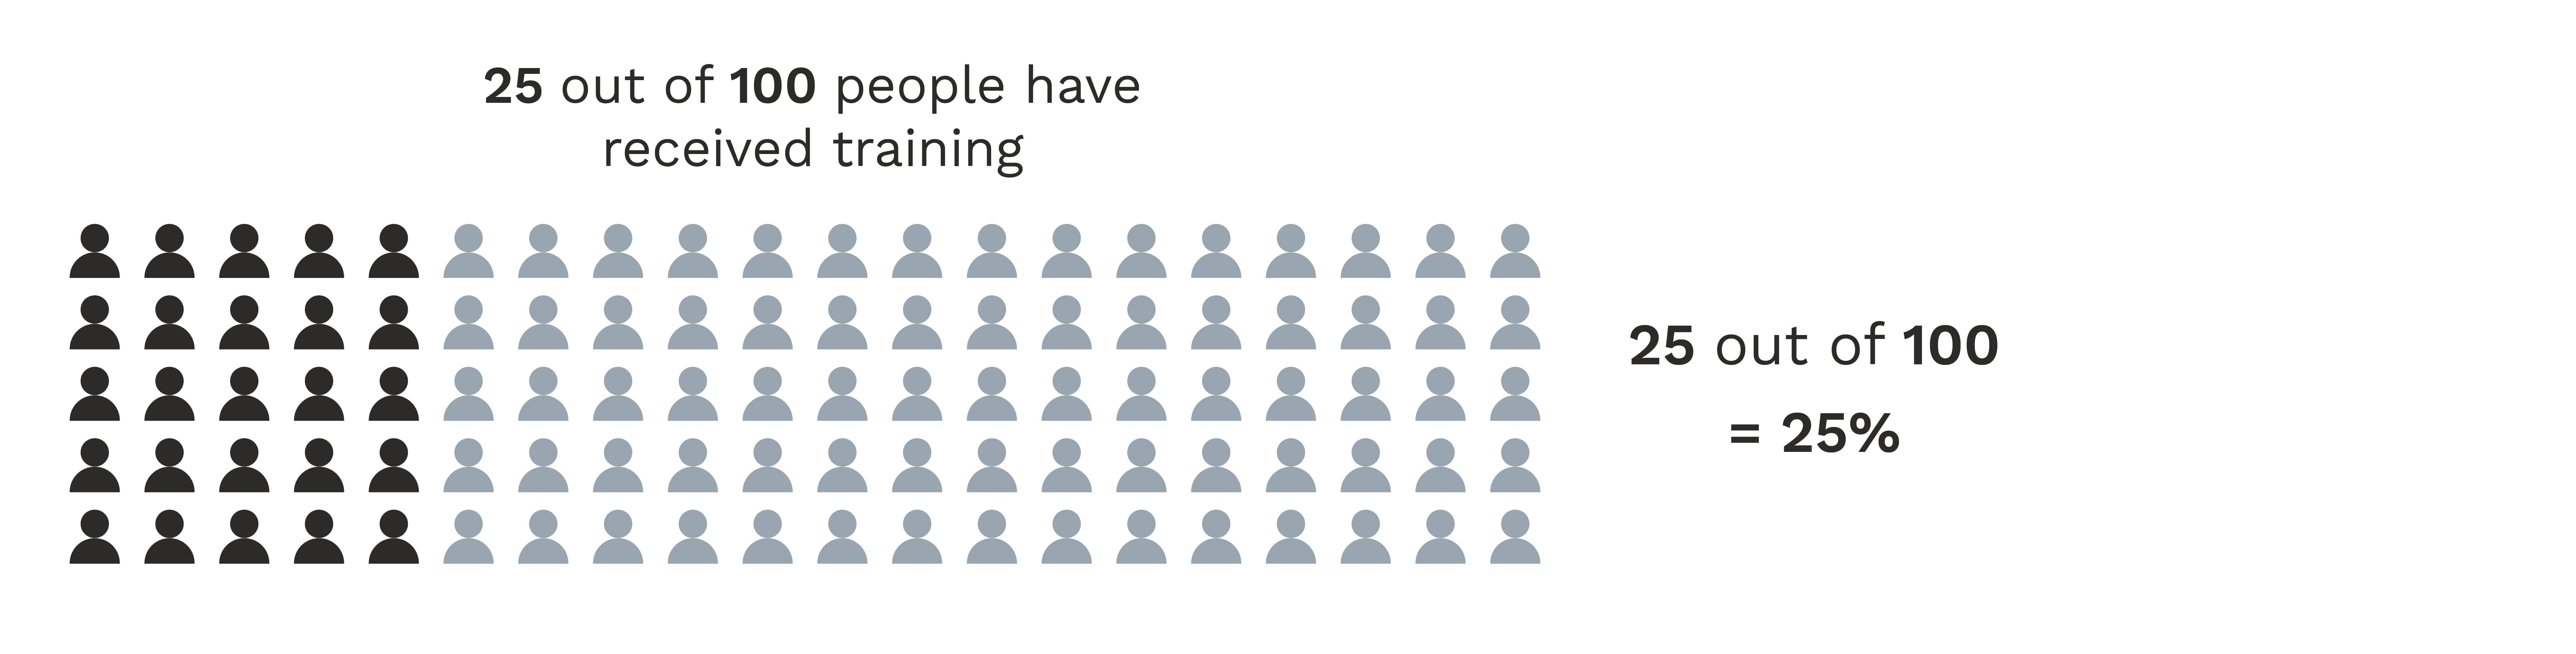
Besides being especially useful when making comparisons, percentages are useful for studying the size of a change relative to a benchmark or initial value.
For example, suppose we want to compare employment growth in two cafés – the first, a neighbourhood café with 10 workers and the other, a café chain with 100 workers. Over the year, both employed 2 more workers (net increase).
While the absolute term was the same for both cafés, it would not be fair to conclude that both experienced the same expansion. Using percentages, the neighbourhood café grew by 20%, while the chain grew by 2%.
How to Calculate Percentages
In general, to compute a value (Part) as a percentage of another (Whole), we use the following formula:

Uses of percentages
The most basic application of percentages is to compare one quantity against another, with the second quantity rebased to 100. Suppose we are interested in the number of employed females as a percentage of all employed.
Essentially, we are comparing the number of employed females with the number of employed people using the fraction:

If this fraction is 1/2, it means that for every two employed persons, one is female. We convert this to a percentage by multiplying by 100. The formula then becomes:

Following the previous example, if the fraction is 1/2 , then the percentage of employed females out of all employed is 50%.

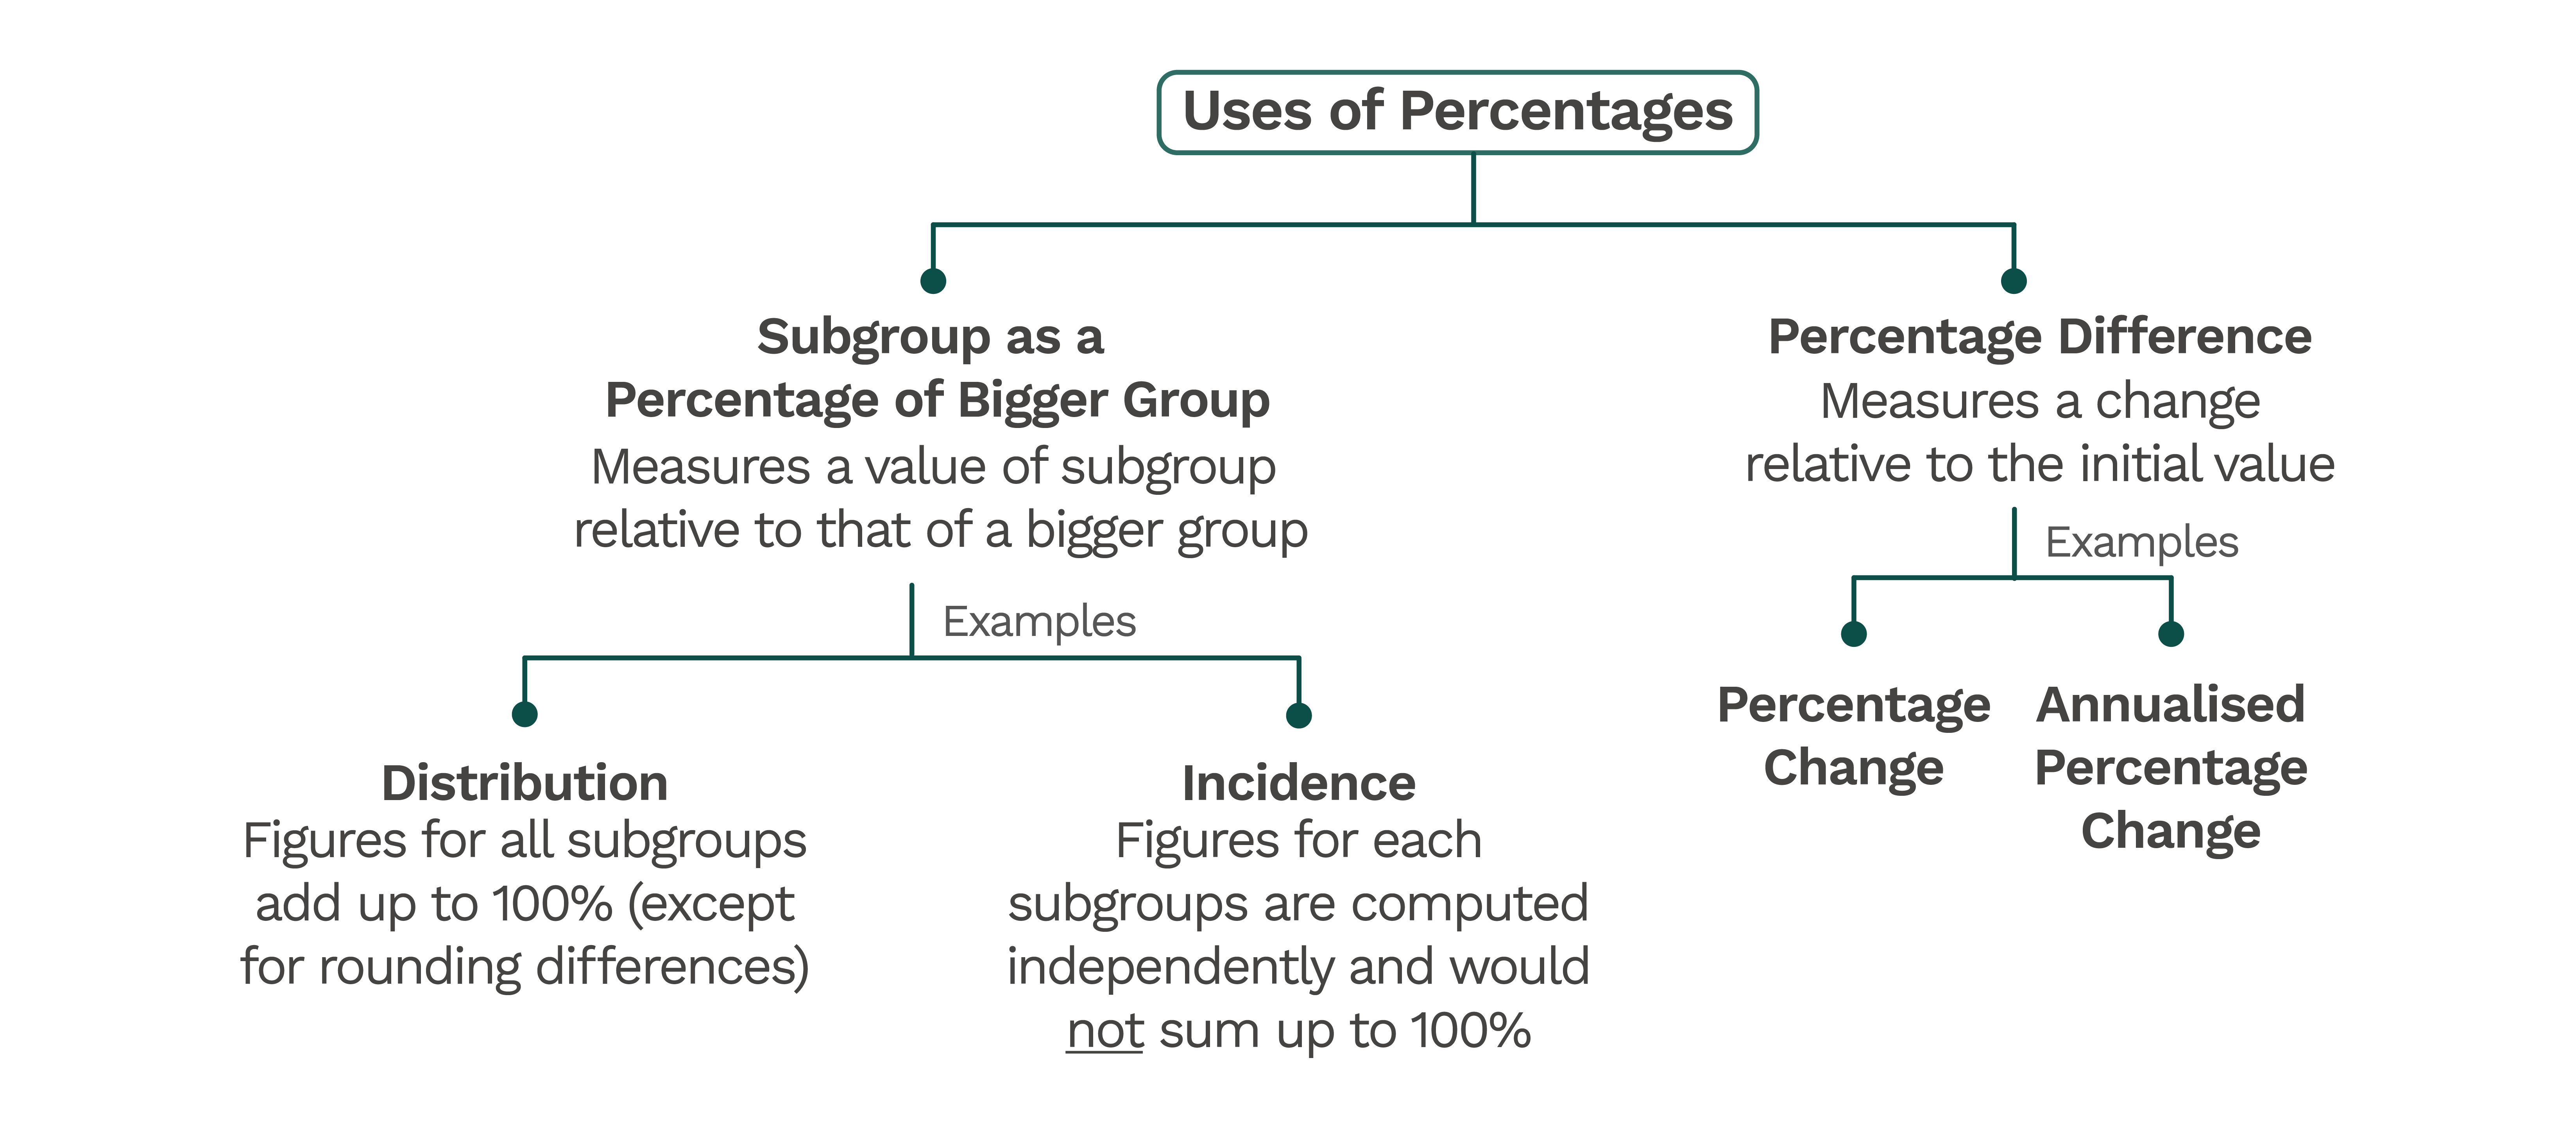
In general, percentages can be used in two major ways, as shown in the following figure.
Major Uses of Percentages
Example 1: Percentage Change
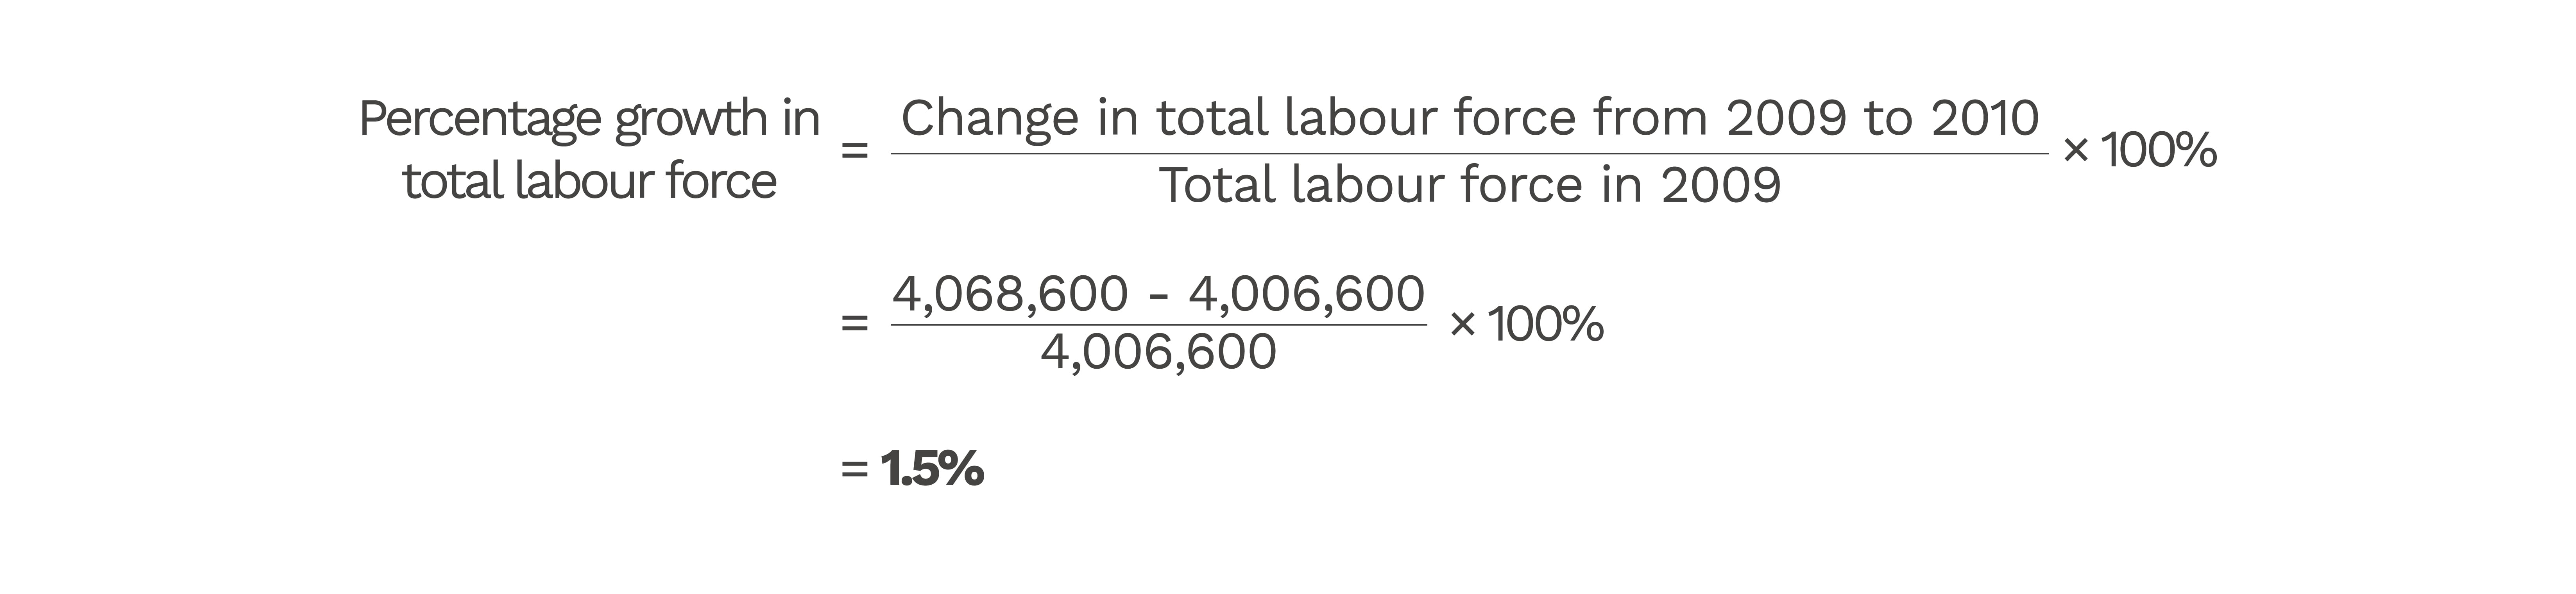
From June 2024 to June 2025, the total labour force grew from 4,006,600 to 4,068,600. The increase was 458,000. What was the percentage increase from 4,006,600?
Since we are comparing the increase with the total labour force value in June 2024, this is the base value.
Therefore:
Possible Values of Percentages and What They Mean
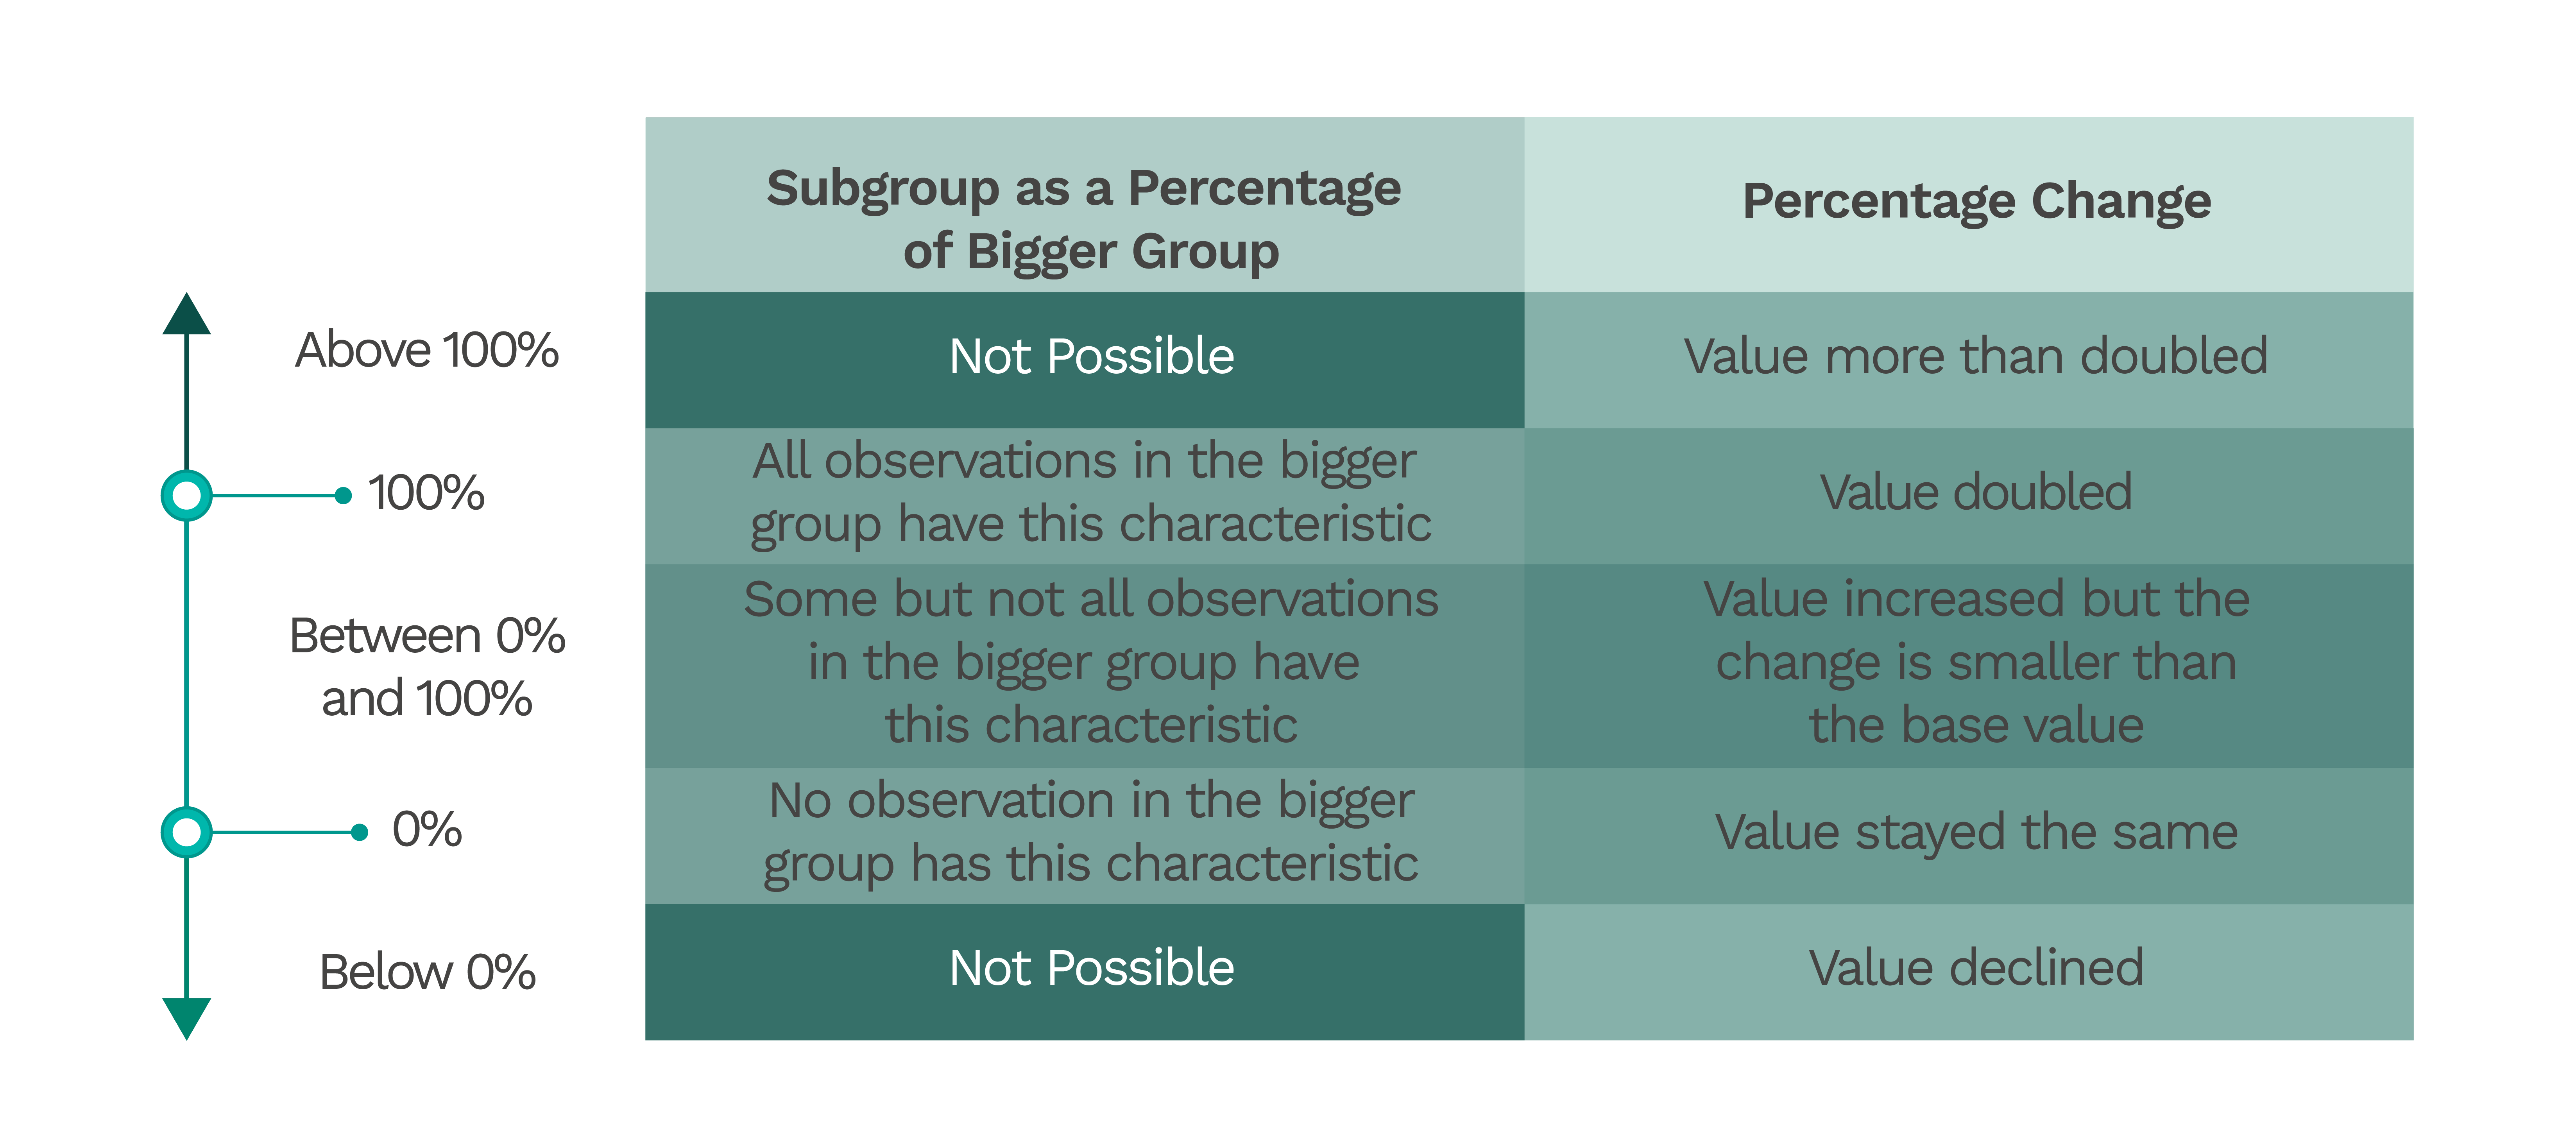
Although the base is 100, percentages can fall outside the 0 to 100 range. There may be occasions when percentages are less than 0 or more than 100.
What does this signify for percentages of subgroups and percentage change? Refer to the figure below. Additional examples can be found in Example 2.
Example 2: Negative Percentages
The total number of workers made redundant in 2023 was 14,590. In 2024, the number of workers made redundant was 1,570 fewer than in 2023. To compute the percentage change in the number of workers made redundant from 2023 to 2024:
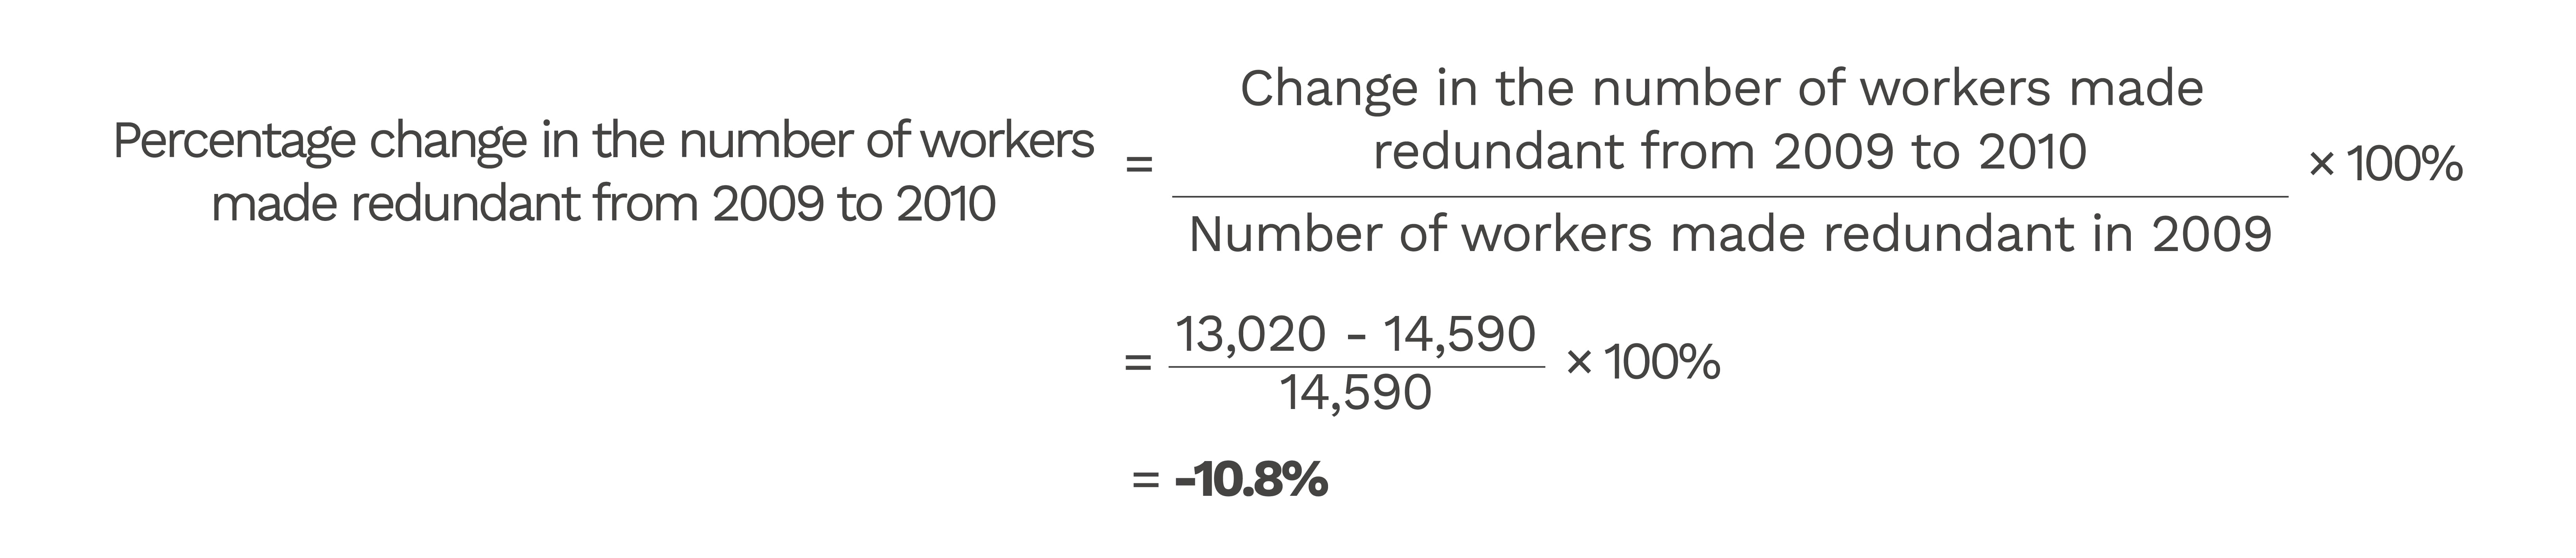
Depending on our purpose, the same figure can be computed as a percentage of different bases or benchmarks.
Example 3: Comparing Percentages with Different Bases
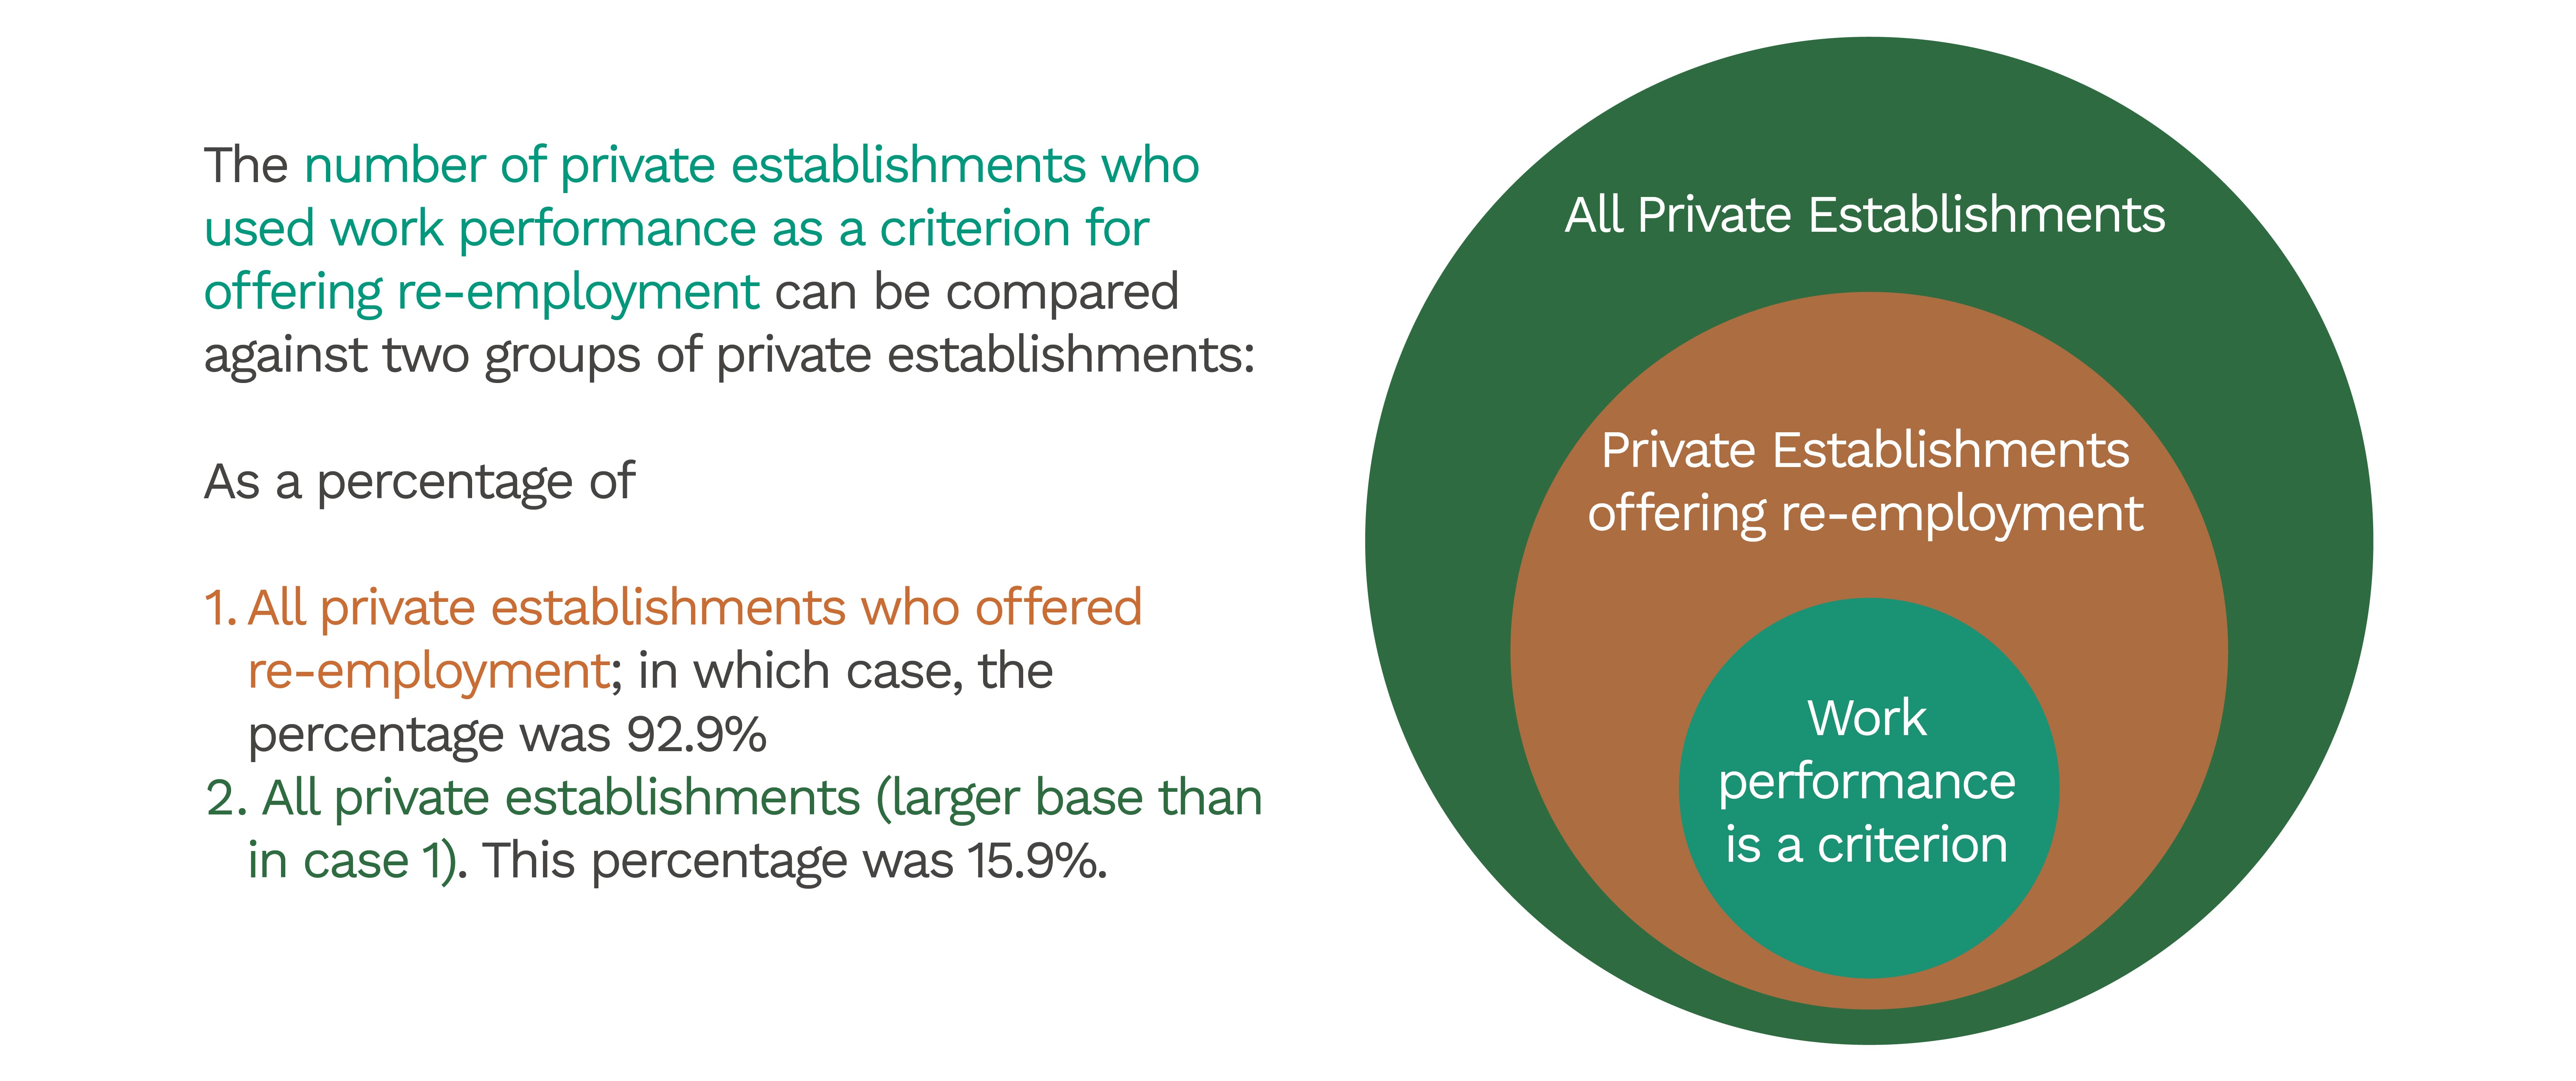
Source: Survey on Retirement and Re-employment Practices, 2010, MOM
Note the marked difference in the percentages.
For (1), the base used was restricted to private establishments that offered re-employment (all establishments within the red circle). That is, establishments that did not offer re-employment were excluded from the base.
The formula to compute this percentage is:

For (2), the wider base of all private establishments was used (all establishments within the orange circle).
The formula used was:

We choose the base depending on which group we want to compare with.
If we are interested in finding out how prevalent work performance was as a criterion for offering re-employment among establishments that offered re-employment to their employees, the base in (1) may be more suitable.
On the other hand, someone studying this issue in relation to all companies in Singapore would find it more appropriate to use the base in (2) to compute the percentage.
Therefore, in our analysis, it is important to determine the context for comparison.
Limitations
Percentage change and percentage-point change differ.
When a variable is in percentage terms, we should be careful to distinguish between:
· Percentage change, i.e. relative change; and
· Percentage-point change, a type of absolute change.
For example, suppose the unemployment rate increased from 2.0% to 2.2%.
The increase is 0.2 percentage points.
To compute the relative change, we divide the absolute change of 0.2 by the initial unemployment rate of 2.0. This gives a percentage change of 10%.
Refer to Absolute vs Relative Change for more information.
A smaller percentage increase does not mean that the variable has decreased.
Example 4: Working for free?
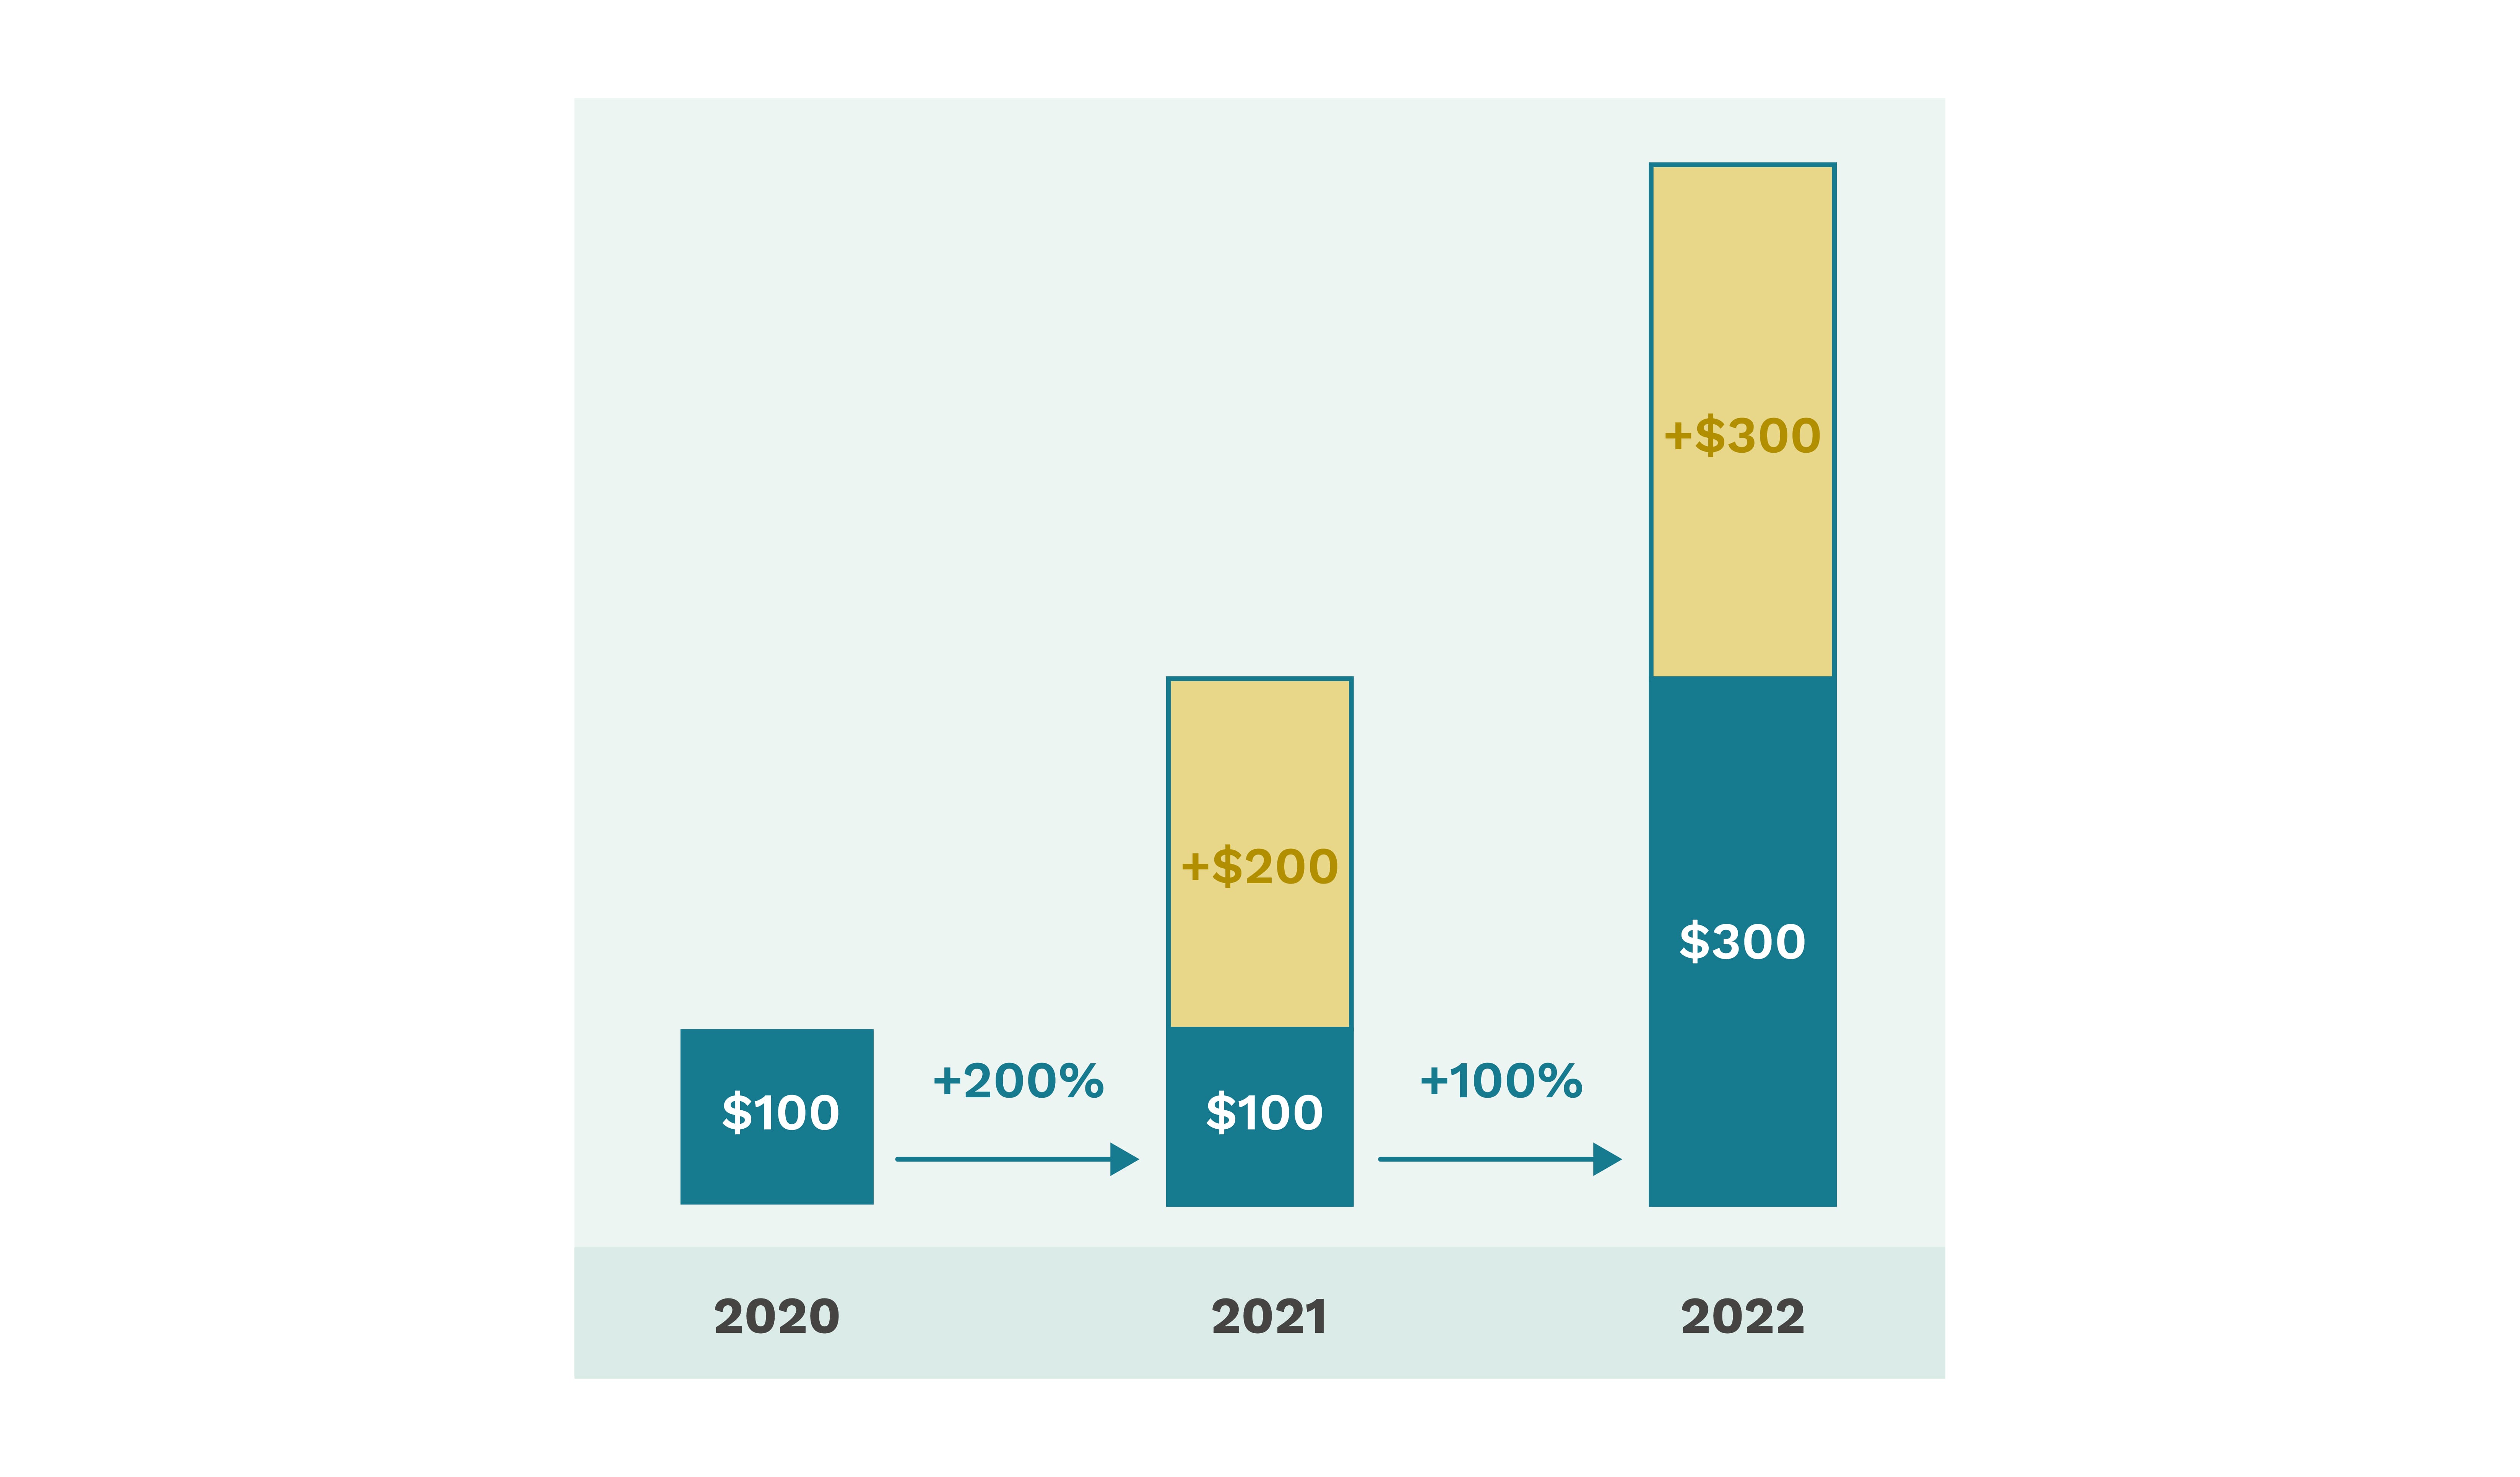
Car racers in Raceland earned $100 every month in 2020. They earned more in 2021, at $300, and this grew to $600 in 2022.
An analyst said that in Raceland, car racers’ percentage wage rise dropped “by 100 per cent” from the previous year.
However, this does not mean that car racers earned nothing in Raceland in 2022. Upon closer inspection, what the analyst meant was that the wage increase dropped from 200% to 100%, which is a difference of 100 percentage points, rather than 100 per cent.
Although the percentage wage change fell from 200% to 100%, the latter wage change was still positive. The monthly wage of car racers still increased from 2021 to 2022.
Monthly Wage of Car Racers
Bear in mind what the 100 per cent is. Example 4 also shows the need to keep in mind what the base, or the 100 per cent, refers to.
· For the percentage wage increase from 2020 to 2021, the base used is $100, the monthly wage received in 2020.
· For the percentage wage increase from 2021 to 2022, the base used is instead the monthly wage of $300 in 2021.
Not all percentages are additive. Only those with the same corresponding base value can be summed, such as in a distribution. Otherwise, it would not be meaningful to add percentages with different bases.
A specific example where bases differ is in calculating percentage change. A decrease of 50% and a subsequent 50% increase does not restore a variable to its original value. This is because a different base is used to derive the percentage decrease and percentage increase.
Refer to Examples 5 and 6.
Example 5: Percentages may not be additive
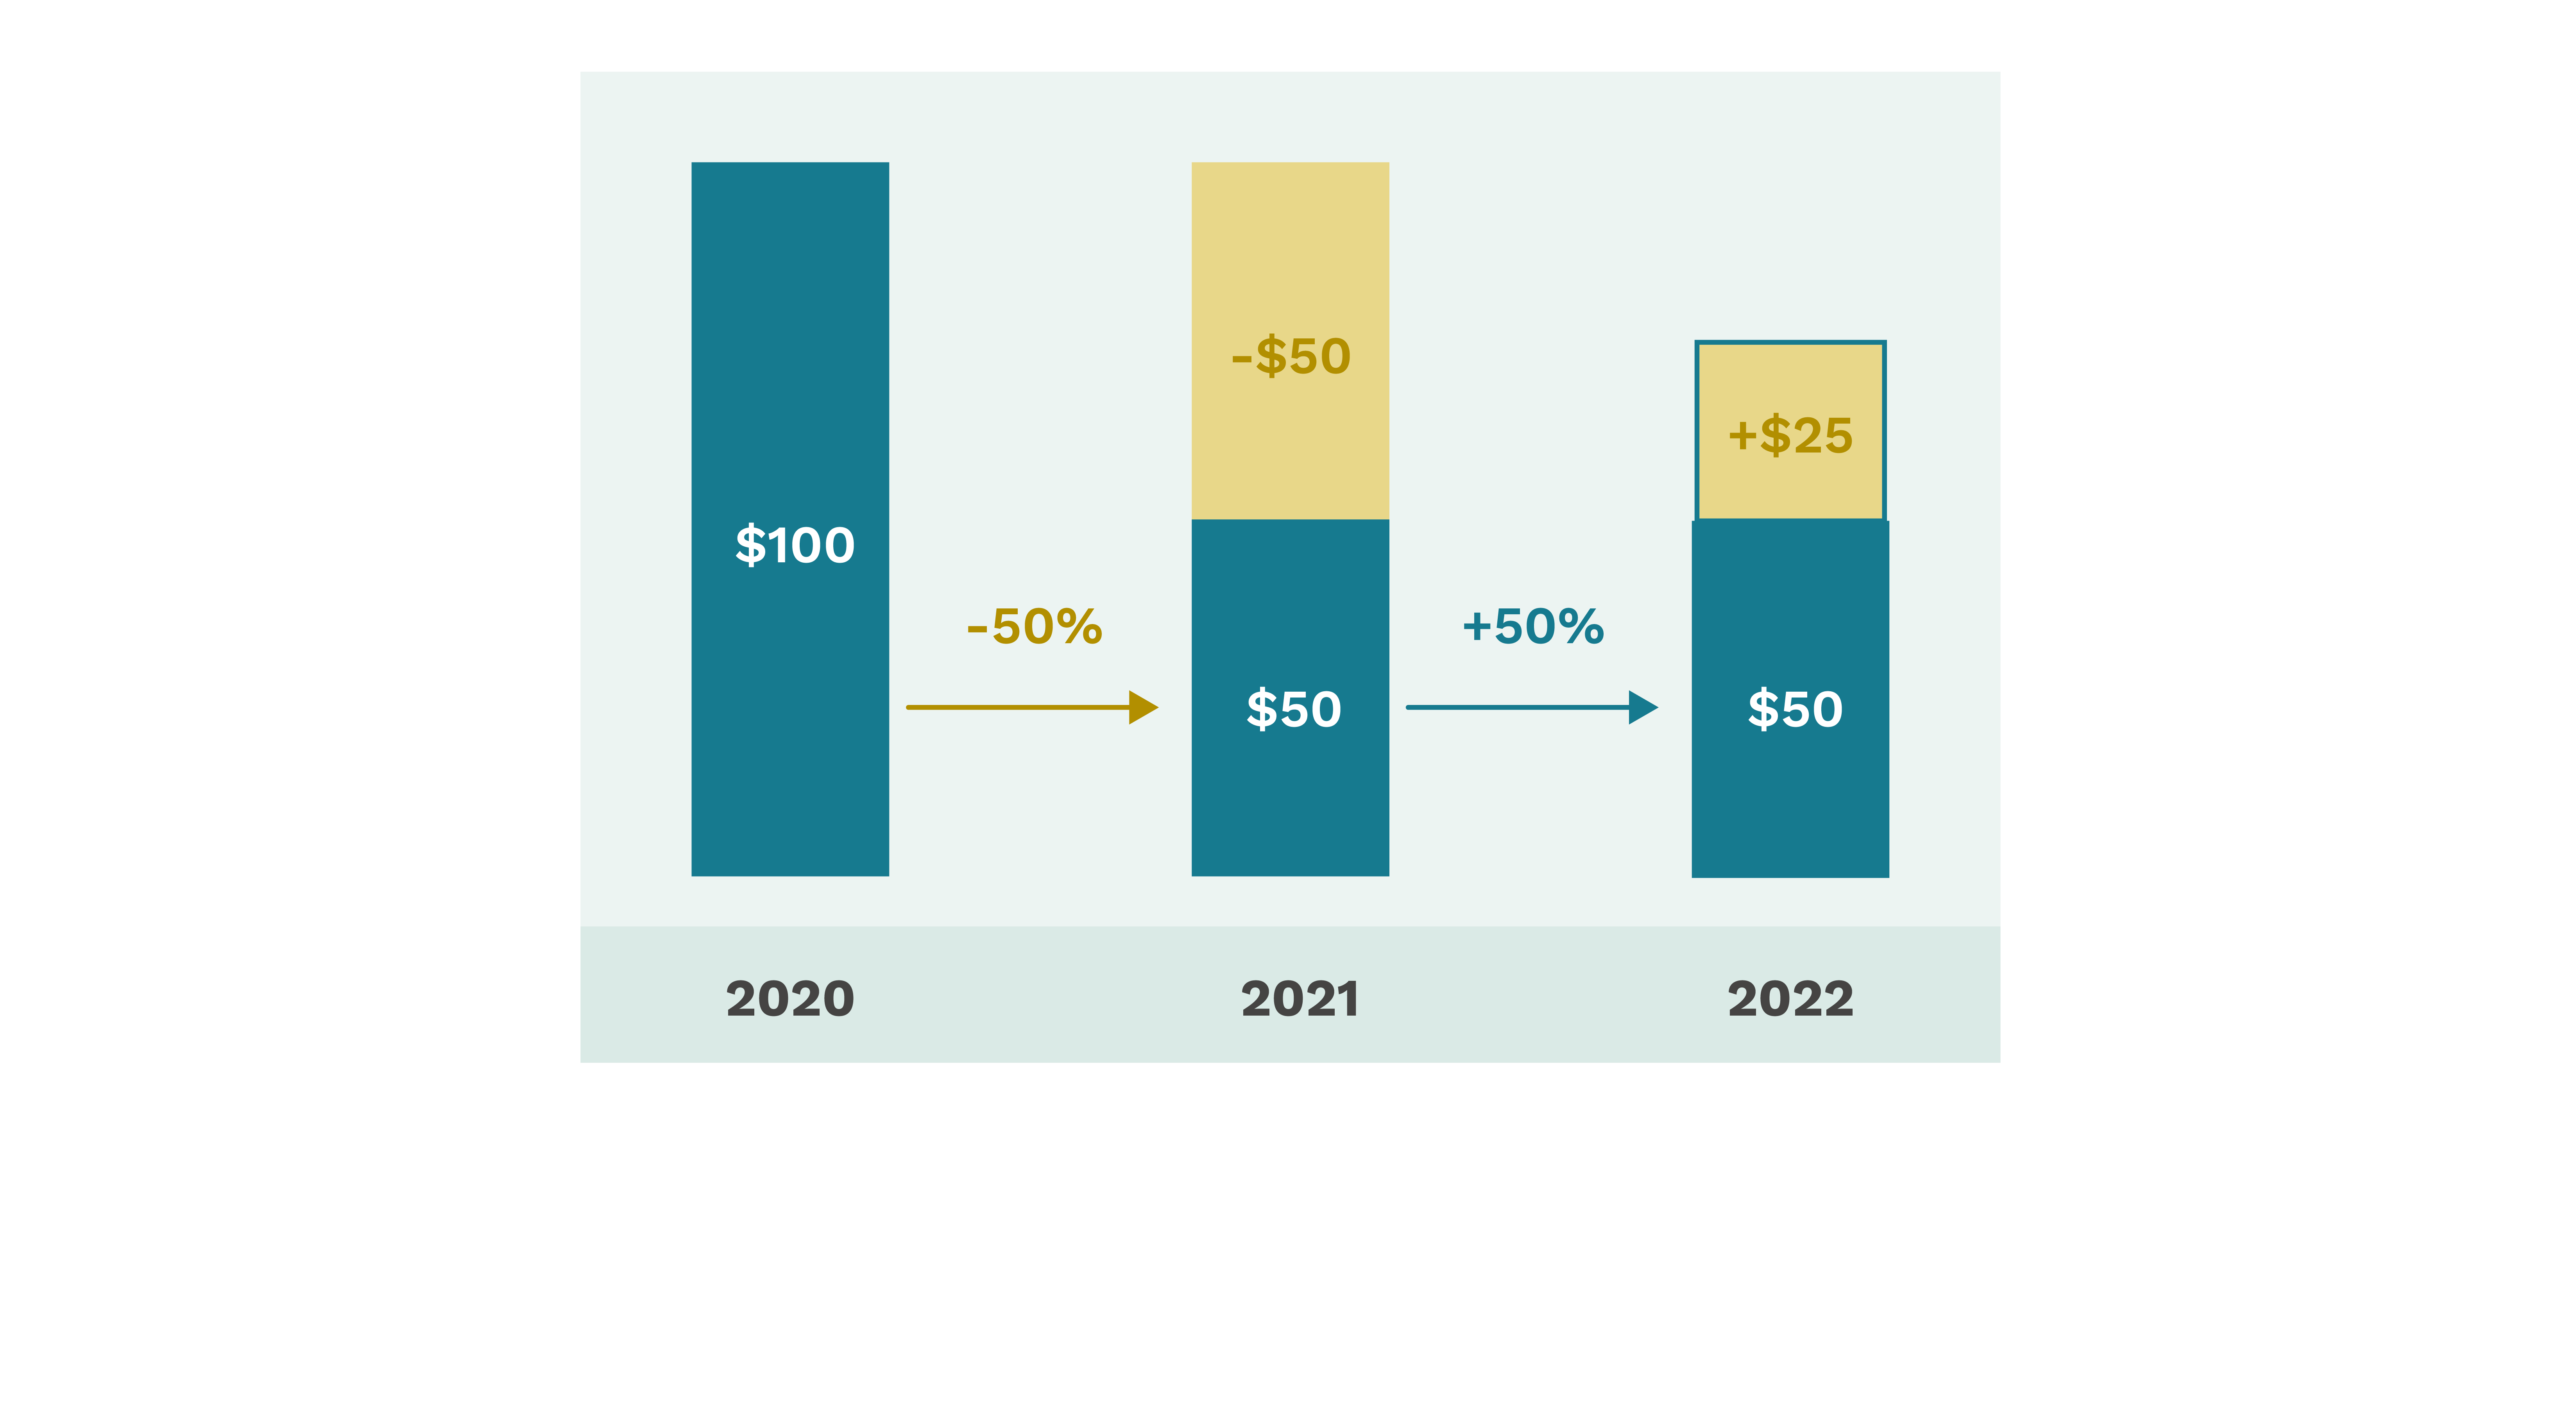
Suppose the wages for car racers in Raceland decreased by 50% from 2020 to 2021, and then increased by 50% in 2022.
Recalling that the wage in 2020 was $100, this does not imply that wages in 2022 were fully restored to their original value in 2020.
The assumption may be that that the total change in wages from 2020 to 2022 was:
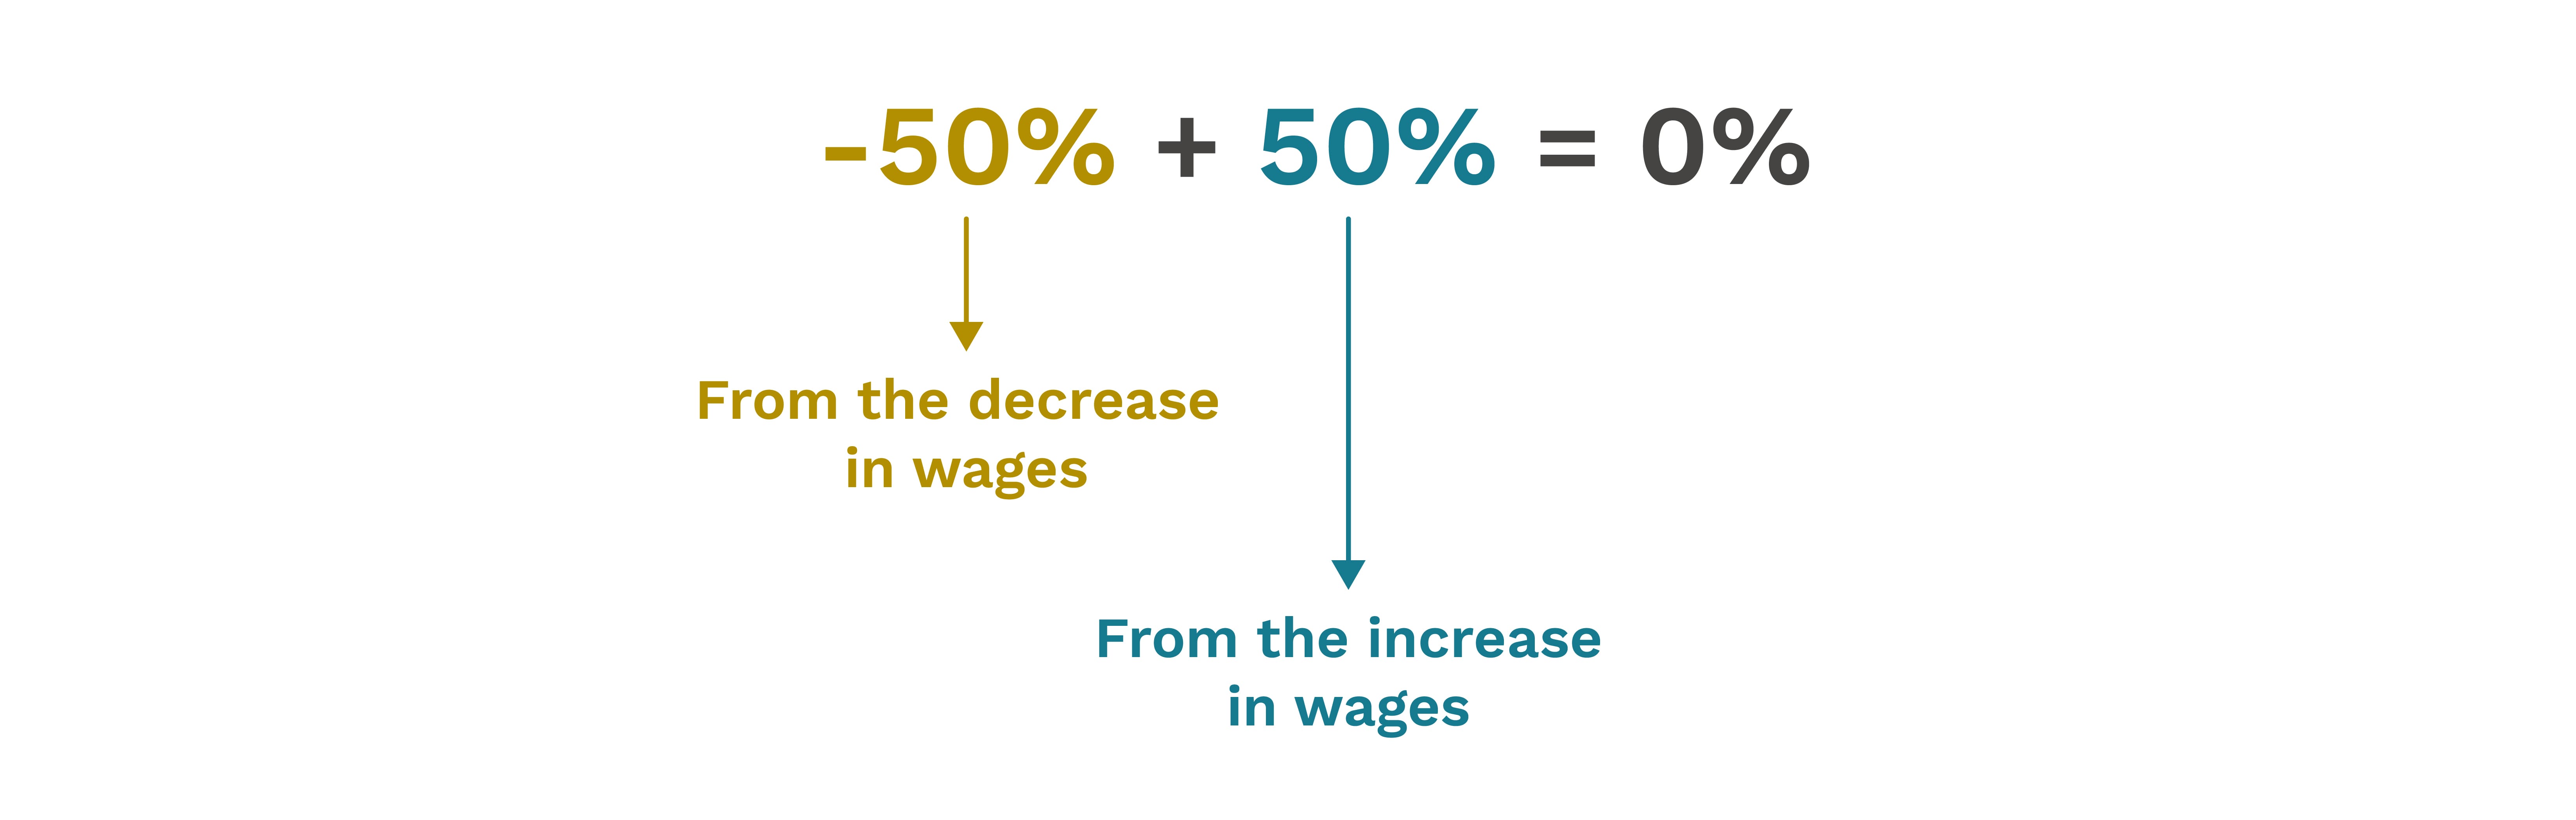
This would imply no change in wages from 2020 to 2022. However, this is incorrect.
A 50% decrease from $100 means that wages dropped by $50. The base here is $100. Therefore, the wage of car racers in 2011 was $50.
An increase of 50% in 2022 relative to the lower base of $50 corresponds to a rise in wages of only $25.
As a result, the wage in 2012 was $75, which is still less than the original wage of $100.
Monthly Wage of Car Racers Over Three Years
Example 6: Percentages may not be additive
Due to business restructuring, Company Megamind has decided to reduce the number of employees by 20% each year from 2021 to 2025. Assuming there are 2,000 workers initially, how many workers will there be at the end of 2025?
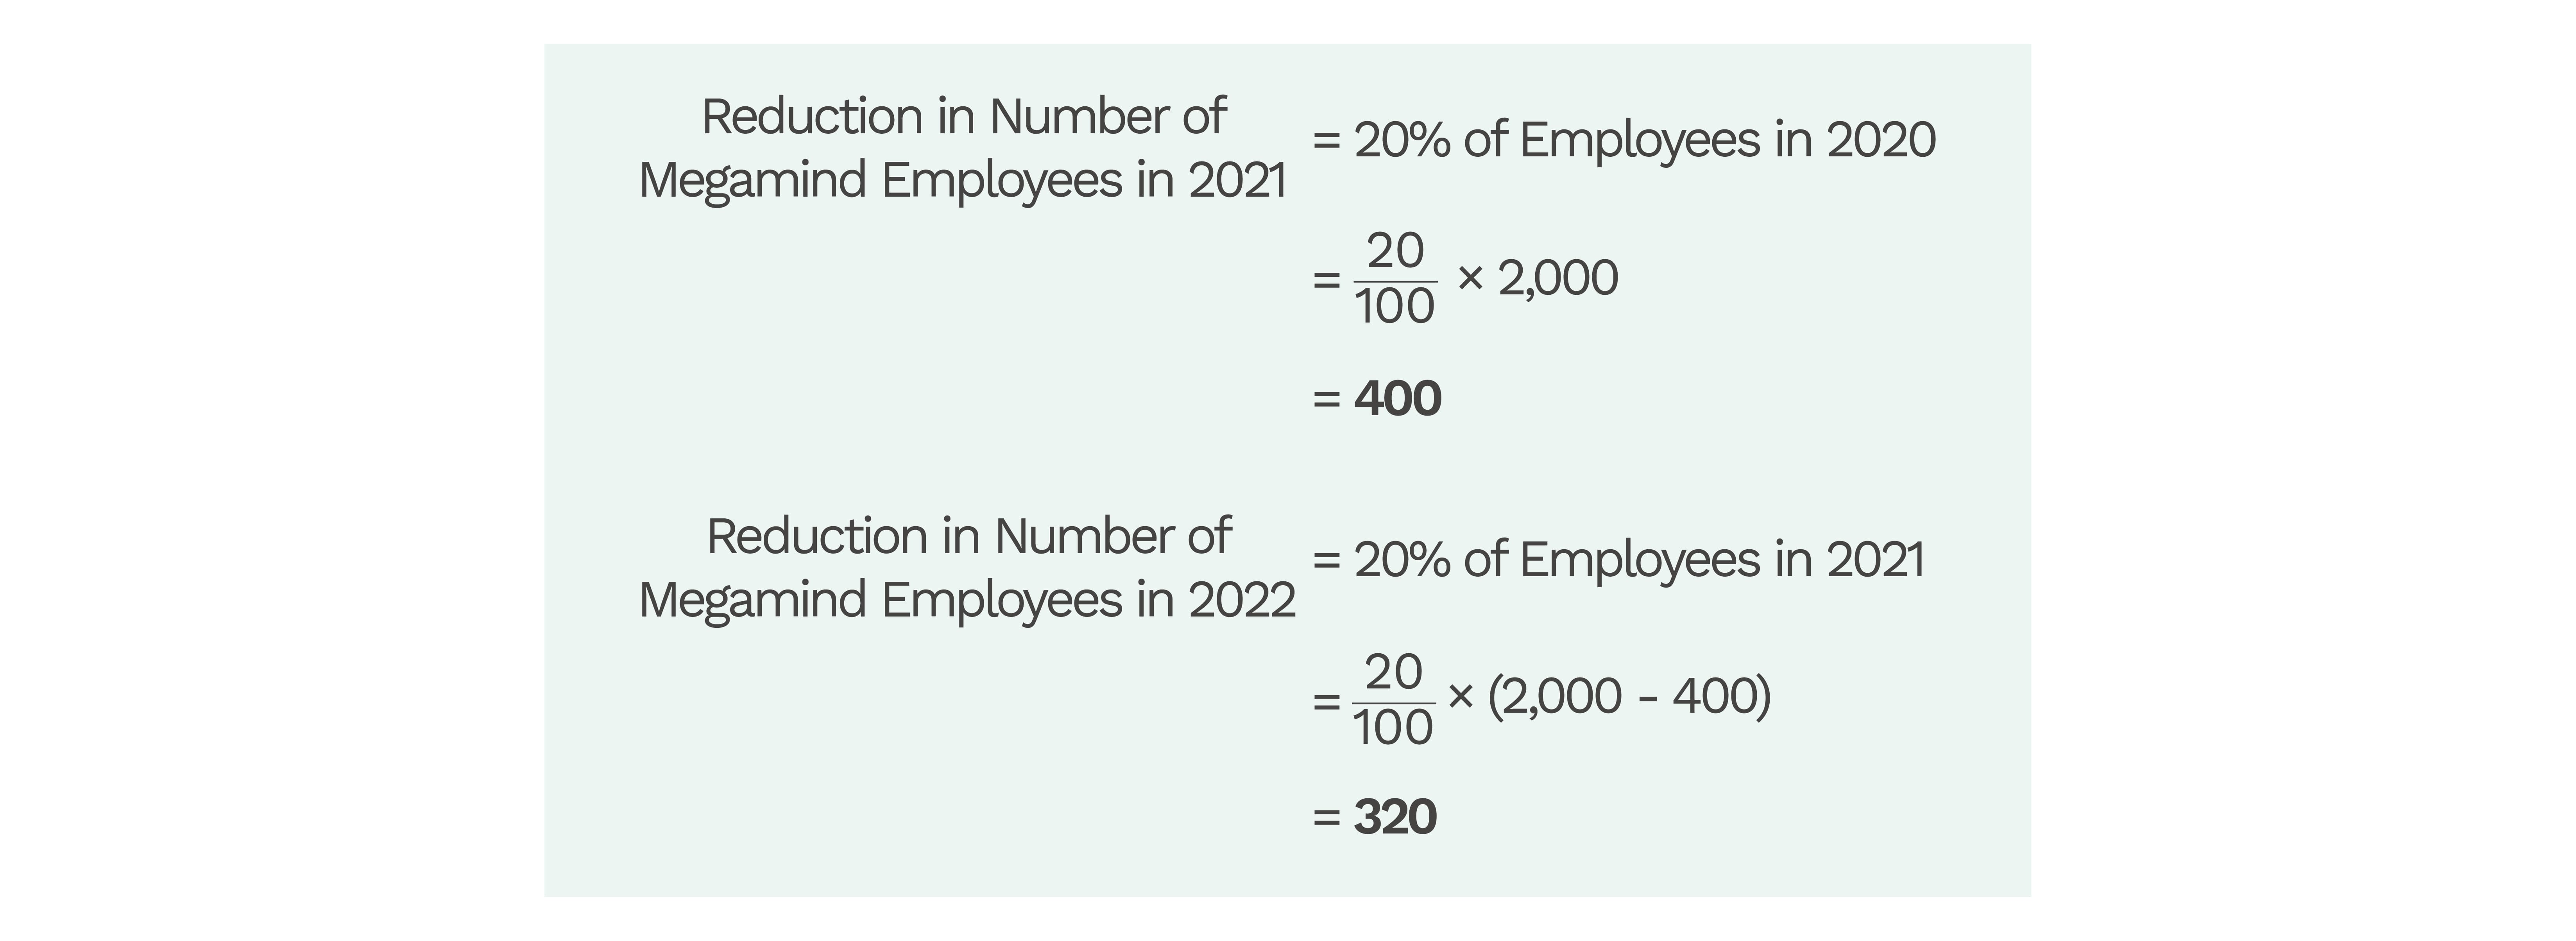
Similarly, the reduction in the number of employees for subsequent years can be calculated, with a different base each year:
Reduction in 2021: base = 2,000.
Reduction in 2022: base = 2,000 – 400 = 1,600.
Reduction in 2023: base = 1,600 – 320 = 1,280, and so on.
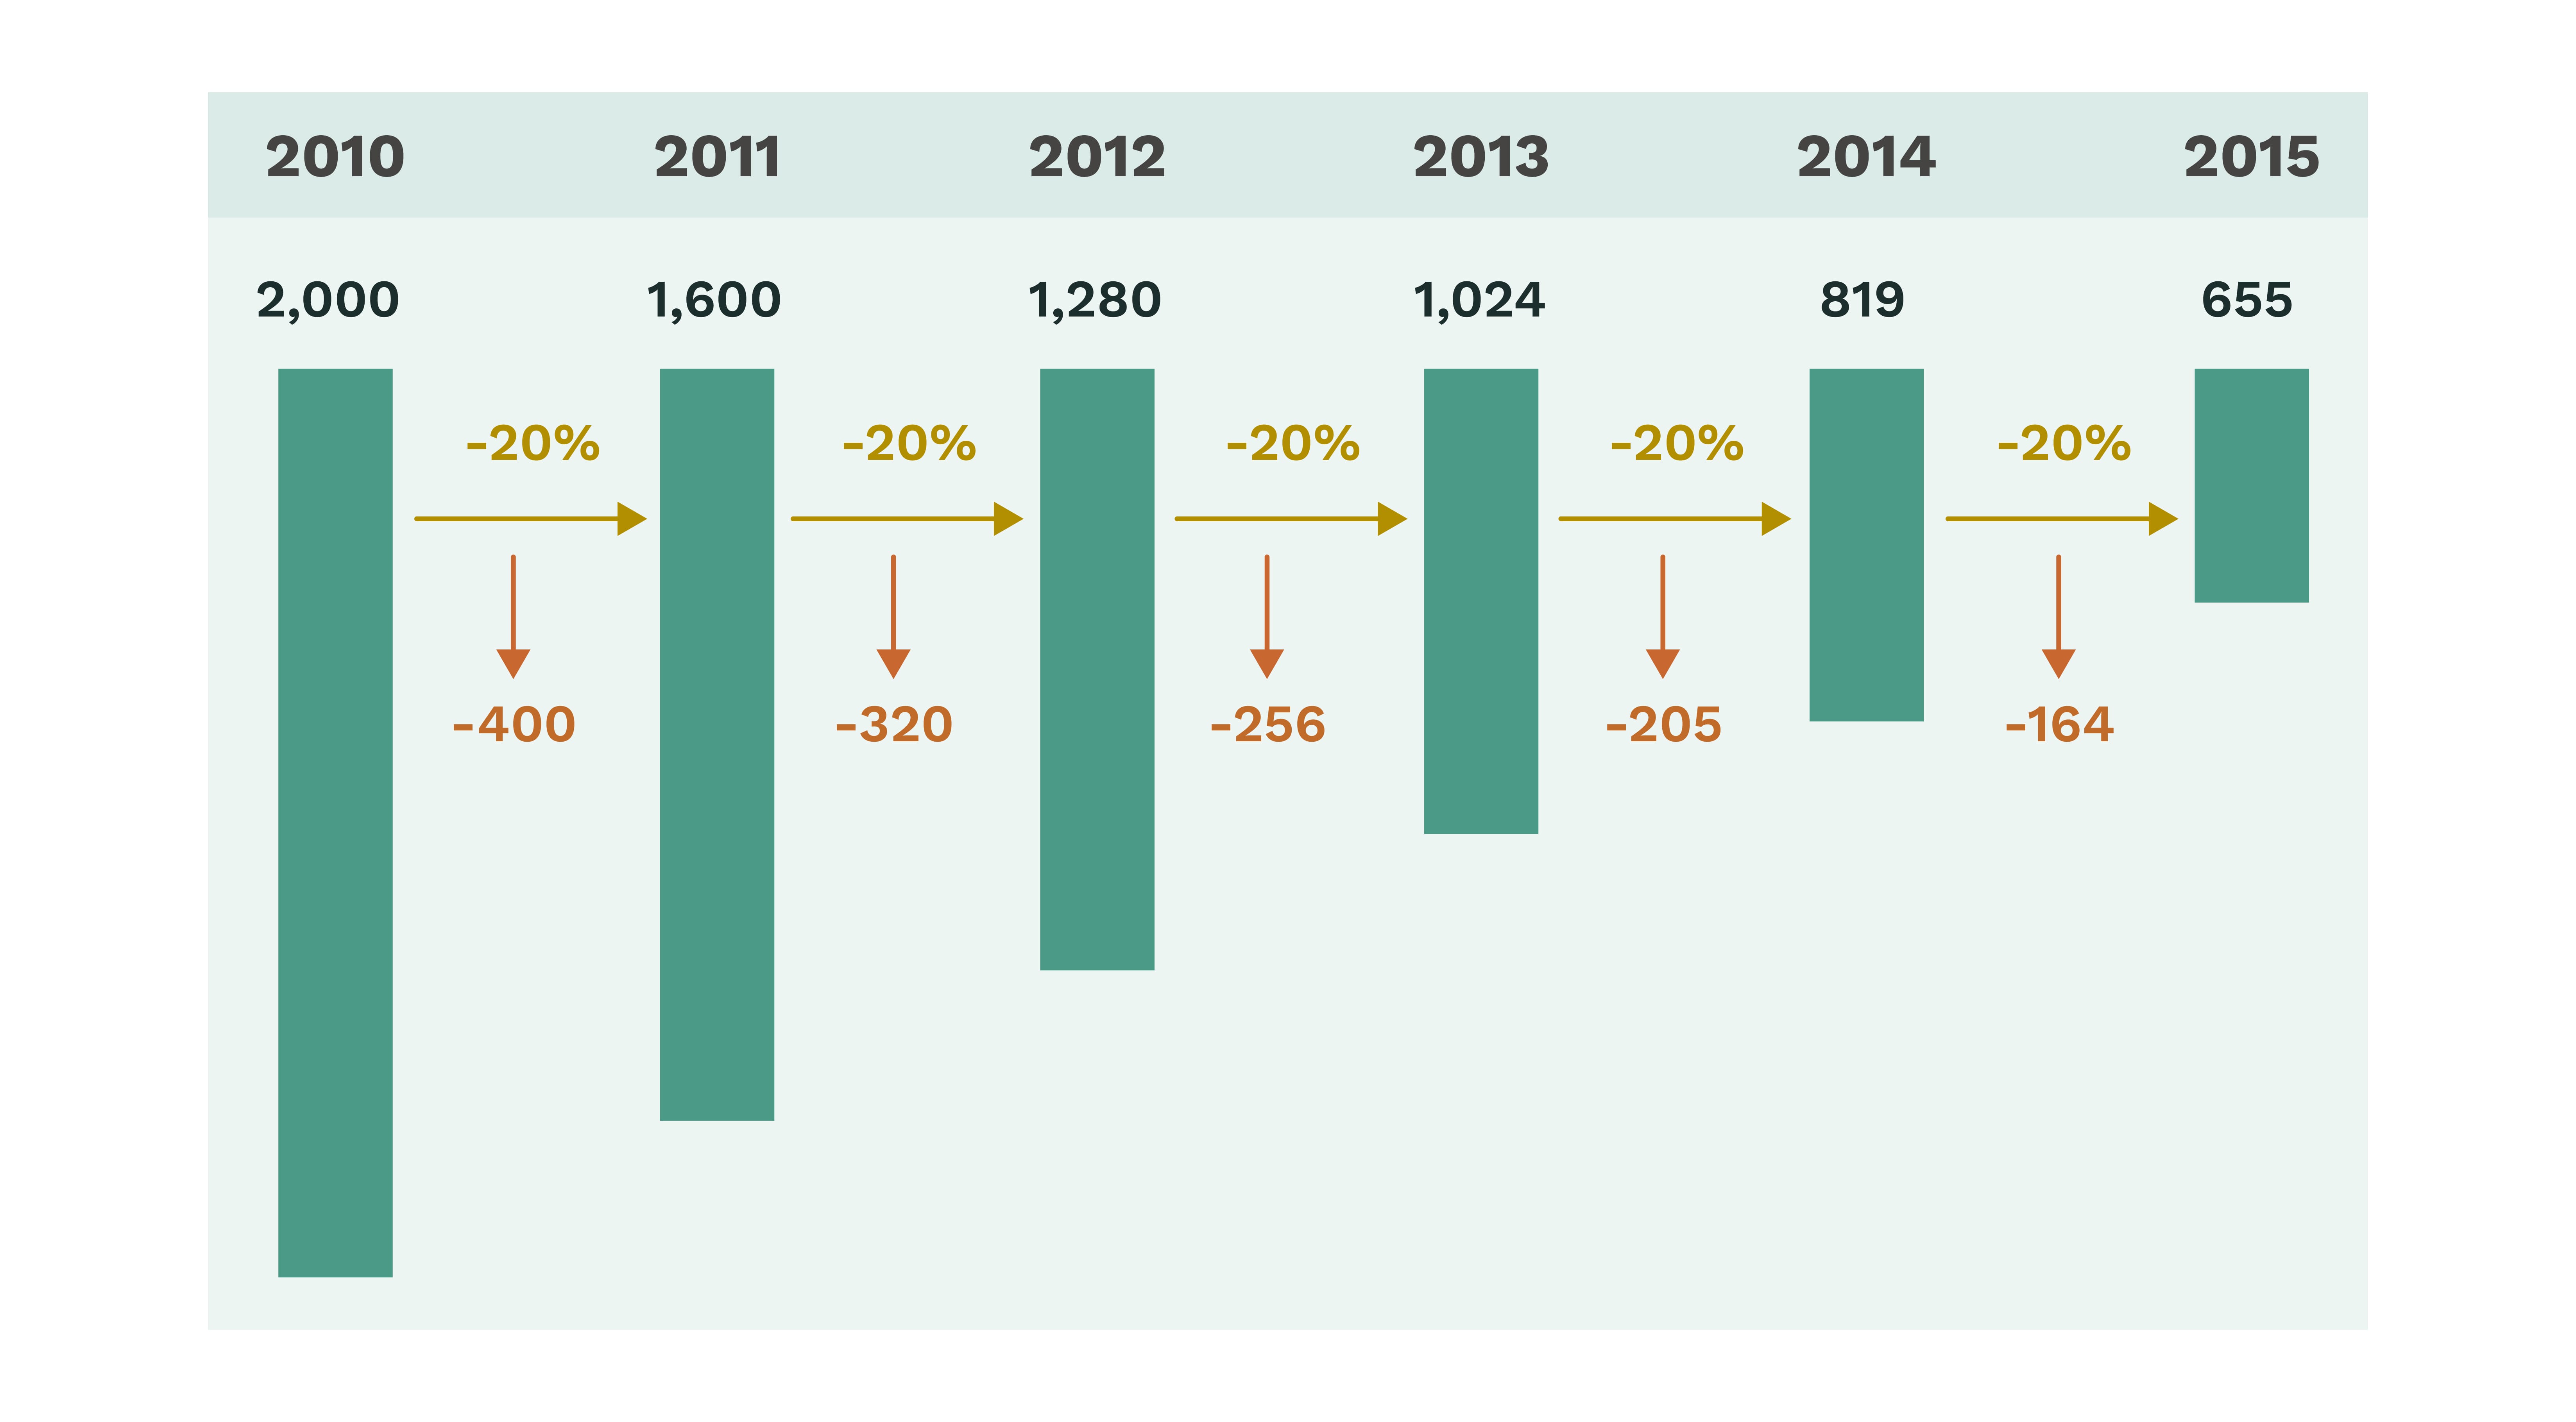
Note that this 20% decrease is a year-on-year change, which is computed based on the number of workers in the preceding year, rather than at the start of the entire period (i.e. December 2020).
If we kept the base at the December 2020 headcount, each year's decrease would instead be fixed at 20% of 2,000, or 400 workers.