
Range
Understanding the concept of range, its uses and limitations
Last updated on 2 November 2026
Understanding range
The range is the most basic measure of the spread of a set of data. It is computed by taking the difference between the maximum and minimum values in the set of data.
How to calculate the range for a set of data
Step 1: Identify the maximum and minimum values in the set of data.
Step 2: Compute the range by taking the difference between the maximum and minimum values:

Example 1
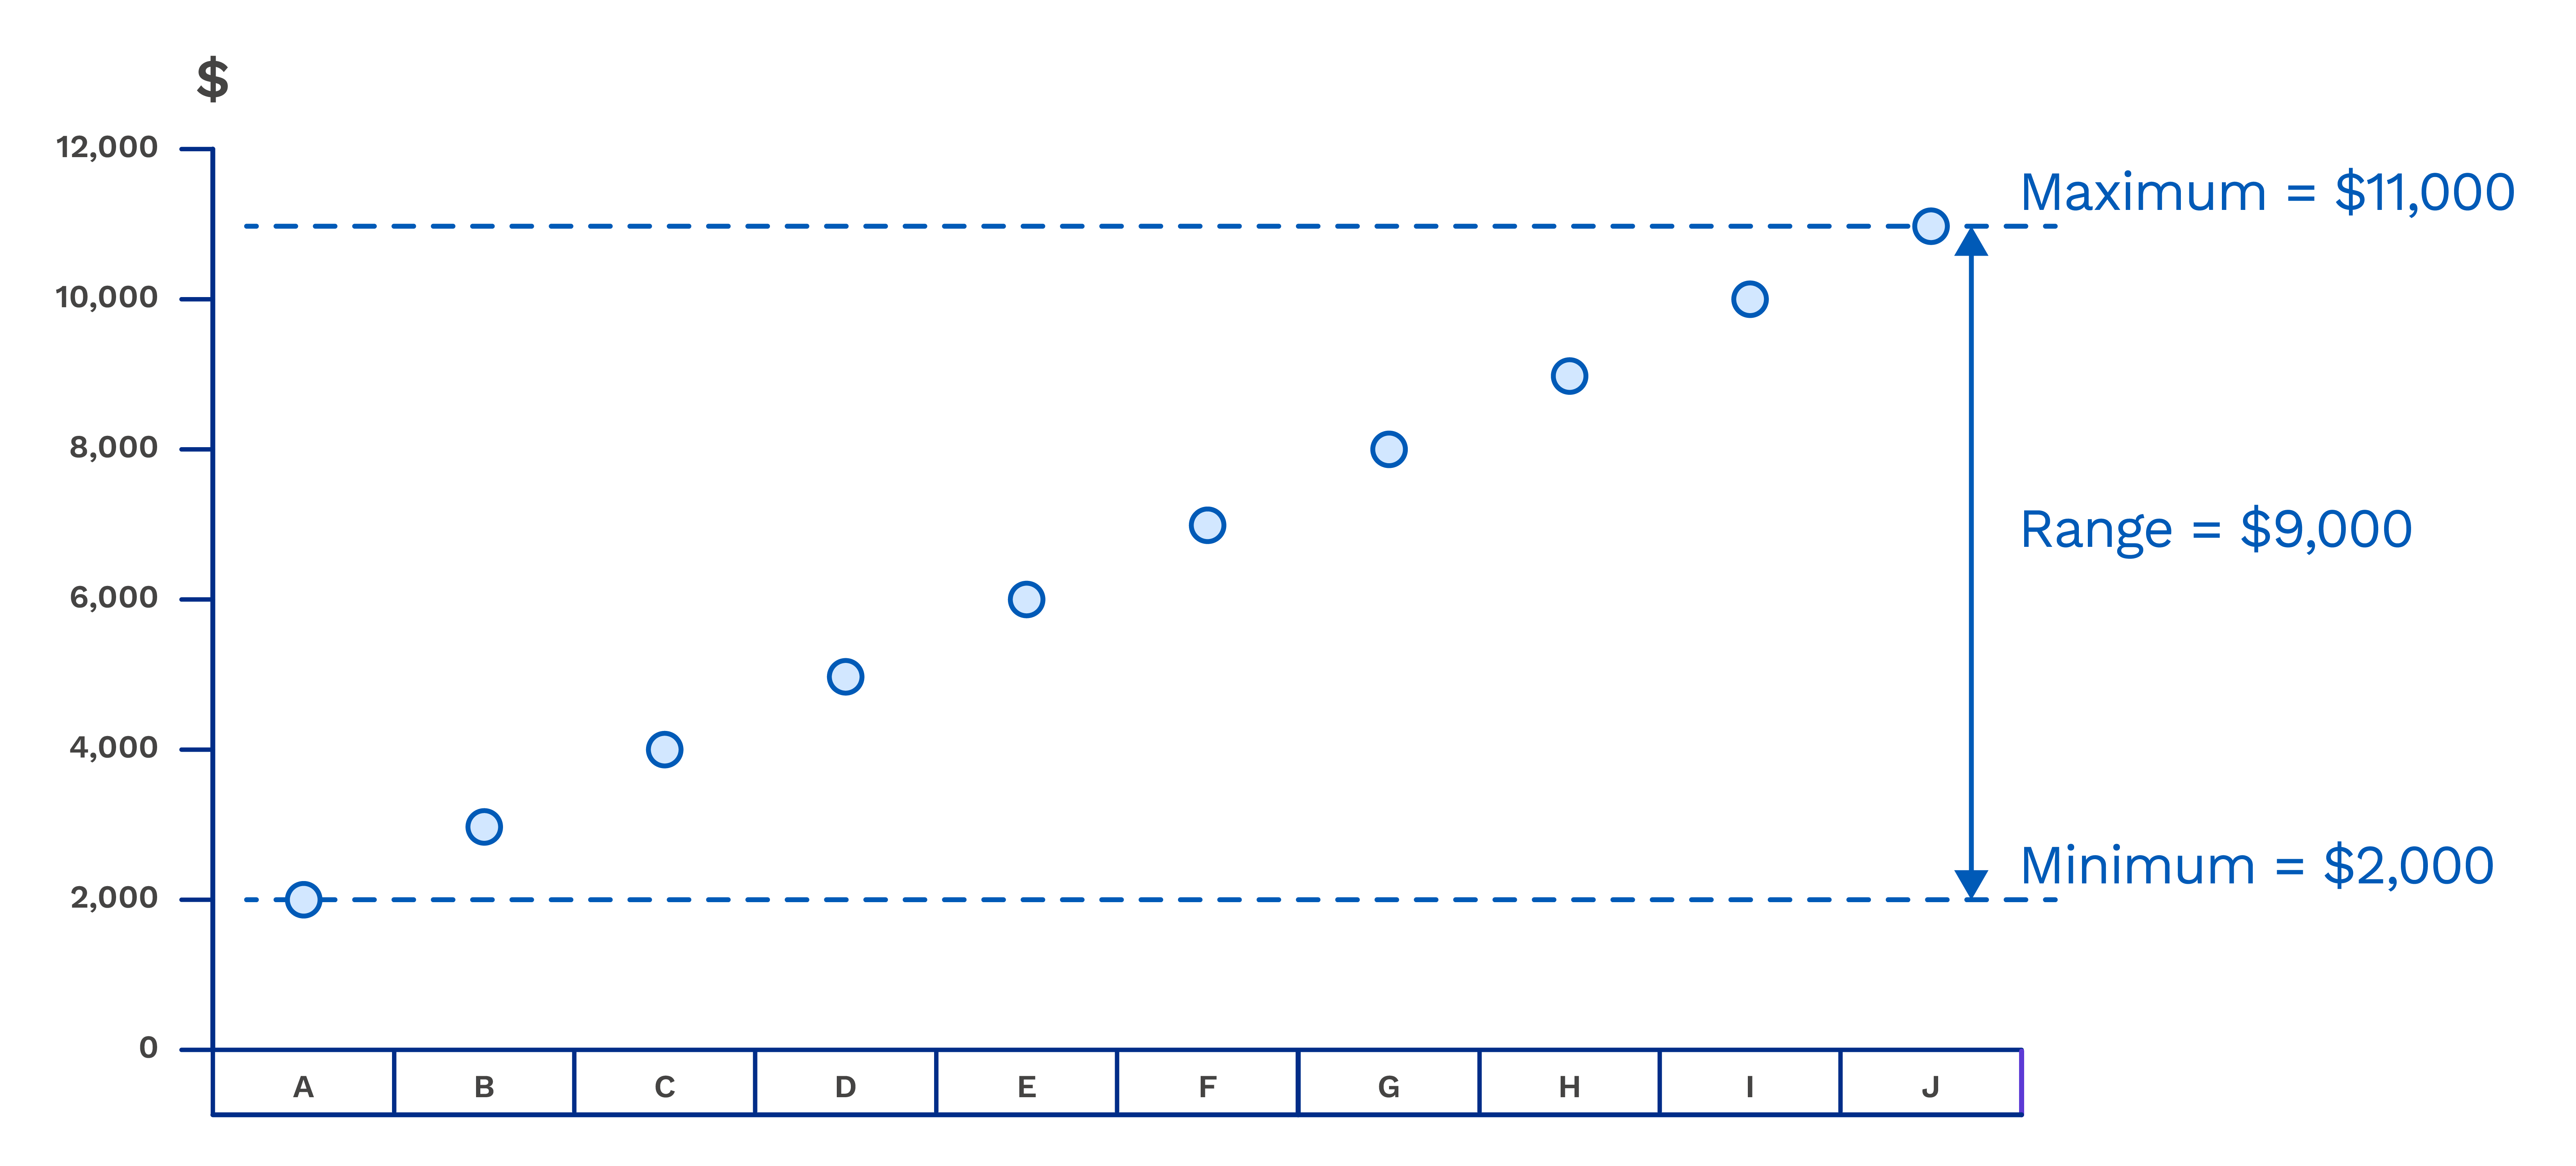
Suppose there are 10 workers in Company X, and their income levels are as follows:
$2,000; $3,000; $4,000; $5,000; $6,000; $7,000; $8,000; $9,000; $10,000; $11,000
The lowest income level for these 10 workers is $2,000, while the highest income level is $11,000.
Hence, Income range for workers in Company X = $11,000 – $2,000 = $9,000.
Income of Workers in Company X
Example 2
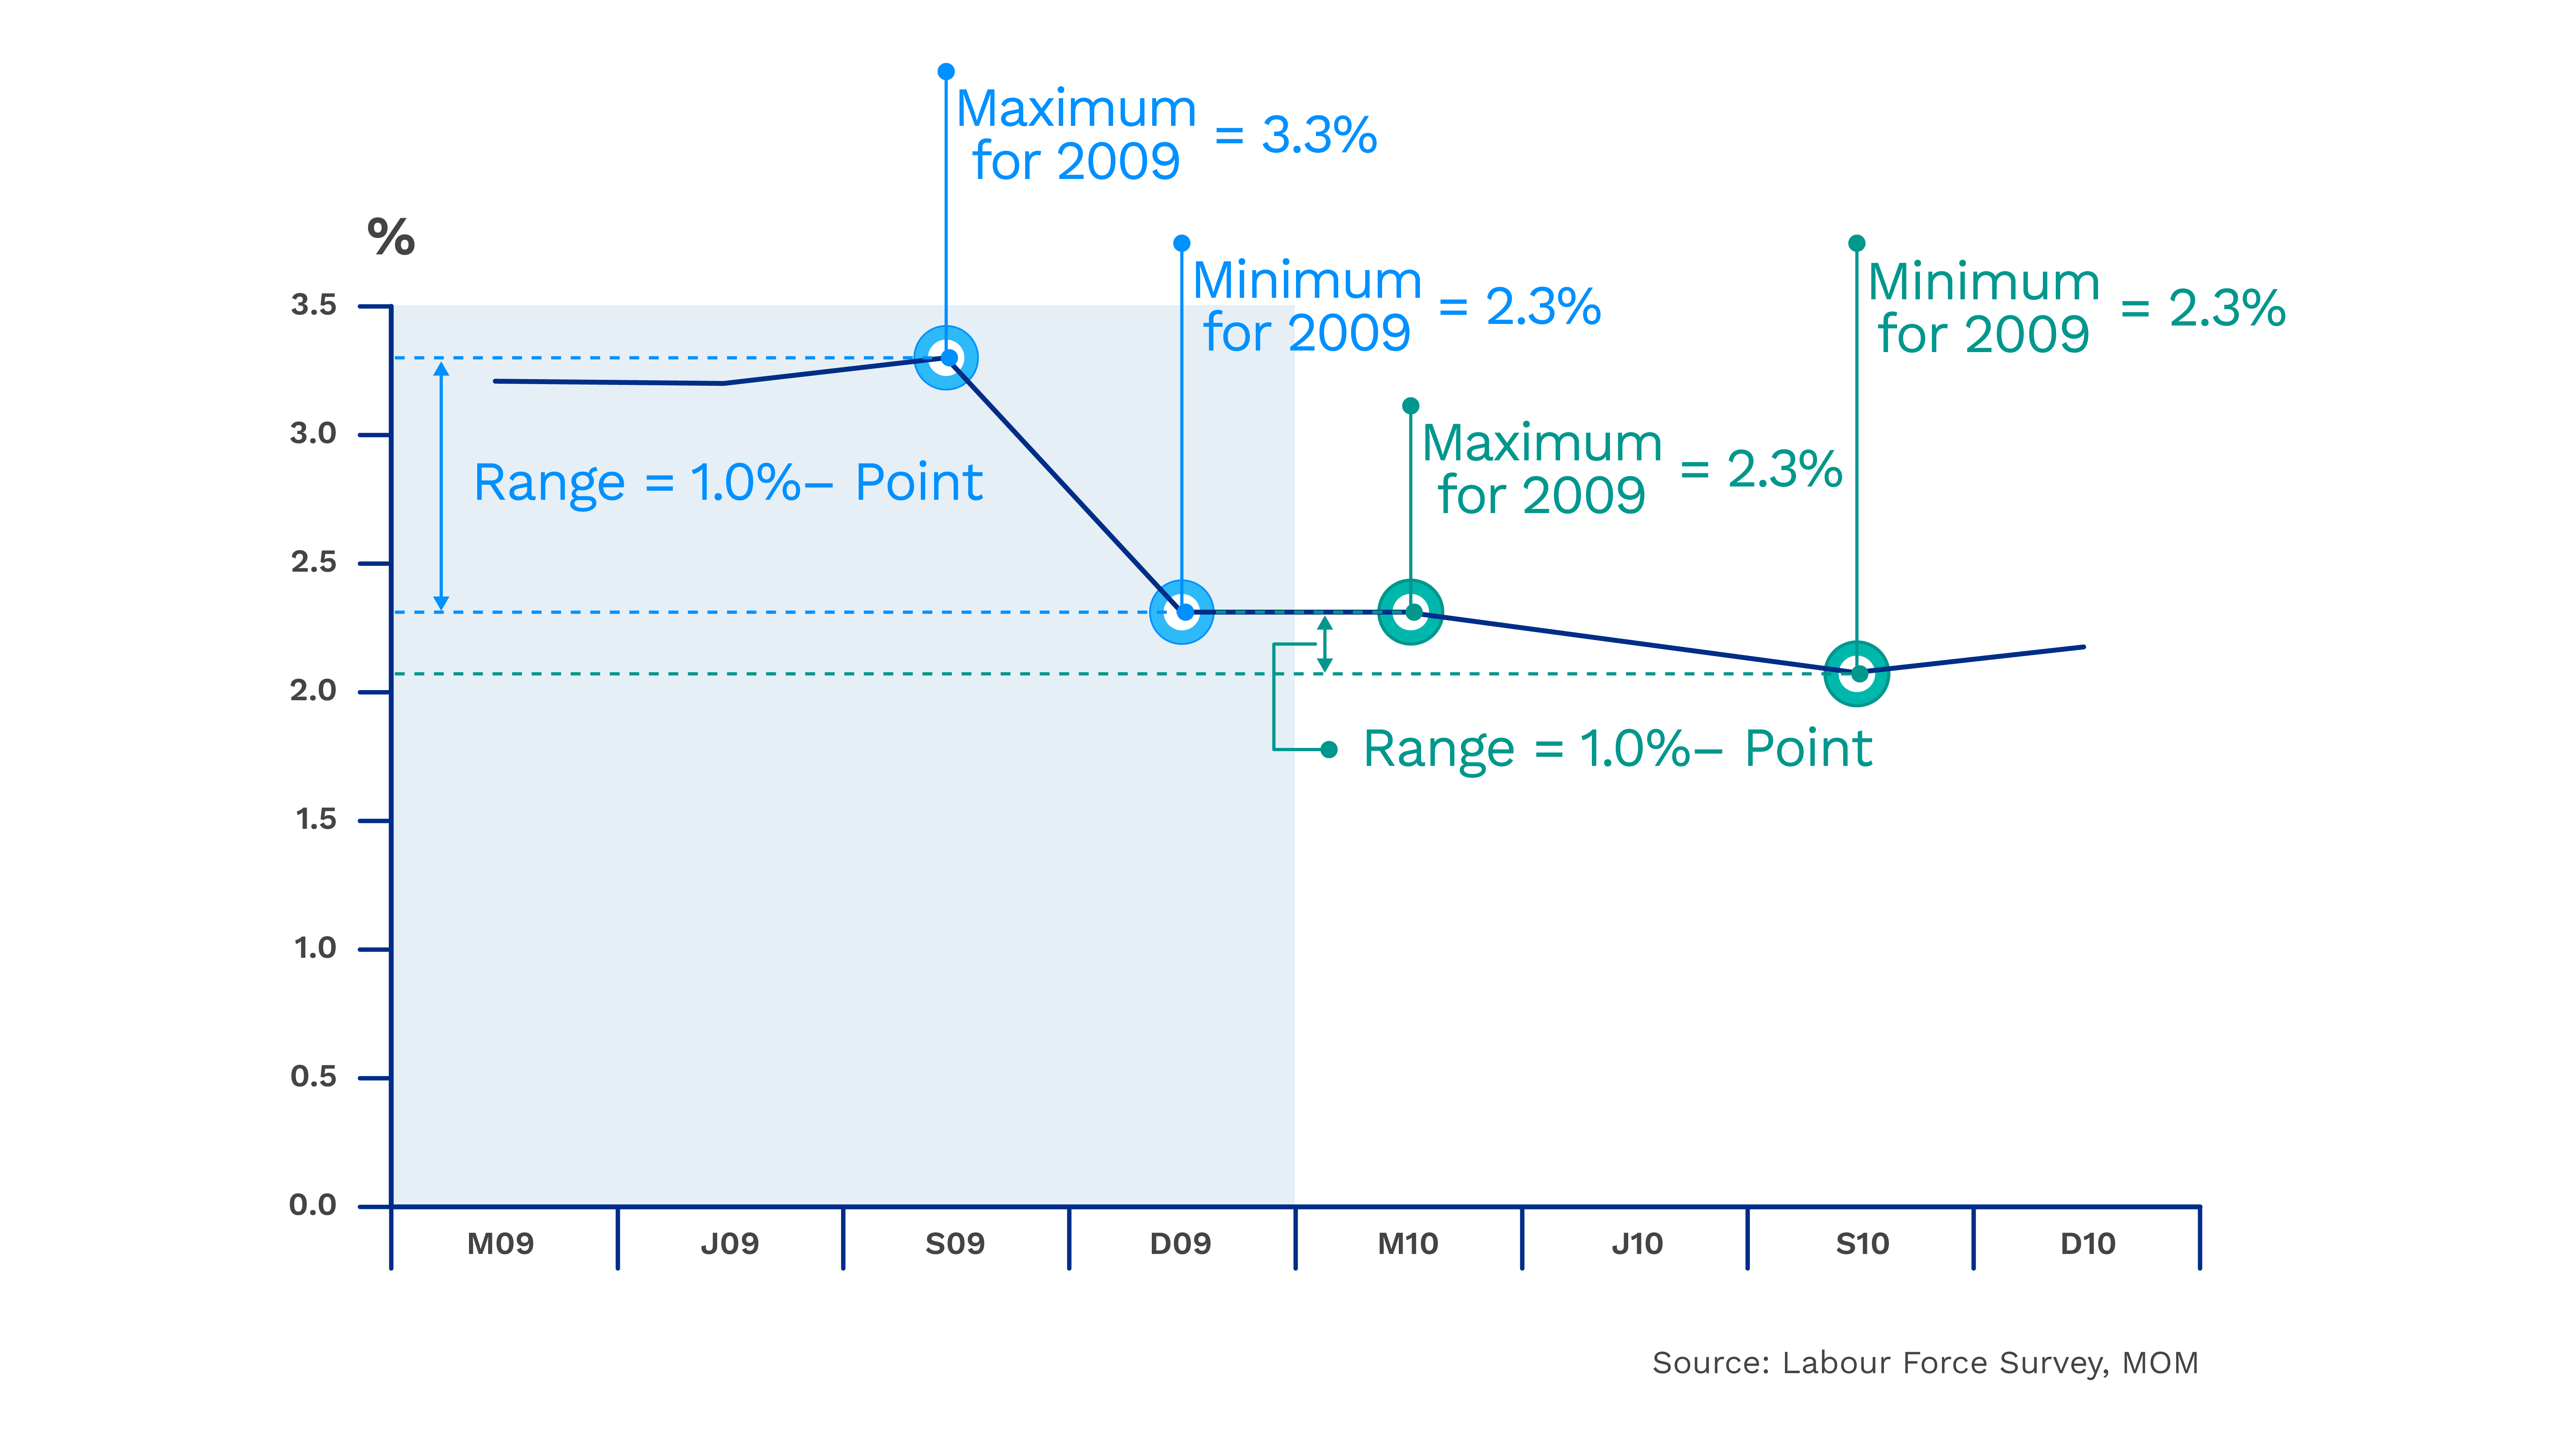
Suppose we want to compare the range in the quarterly seasonally adjusted overall unemployment rate in 2009 with that in 2010.
For 2009, the highest unemployment rate was 3.3% (September 2009) while the lowest unemployment rate was 2.3% (December 2009).
Range of unemployment rate in 2009 = (3.3 – 2.3) percentage points = 1.0 percentage point
For 2010, the highest unemployment rate was 2.3% (March 2010) while the lowest unemployment rate was 2.1% (September 2010).
Range of unemployment rate in 2010 = (2.3 – 2.1) percentage points = 0.2 percentage points
Hence, we can see that the range of the overall unemployment rate was markedly wider in 2009 than in 2010.
Overall Unemployment Rate (Seasonally Adjusted)
Other than expressing the range as the difference between the maximum and minimum values, it may also be useful to illustrate the range by indicating its minimum and maximum values. For example:
The unemployment rate ranged from 2.1% to 2.3% in 2010.
The median gross monthly income ranged from $1,200 for those with no formal qualification/lower primary qualifications to $5,417 for degree holders
Uses
The range of a data set gives a quick sense of its spread.
Given that the range can easily be computed with information on the maximum and minimum values of the data set, users requiring only a rough indication of the data may prefer to use this indicator over more sophisticated measures of spread, such as the standard deviation.
Limitations
The range itself does not provide information on the observations in between the maximum and minimum values.
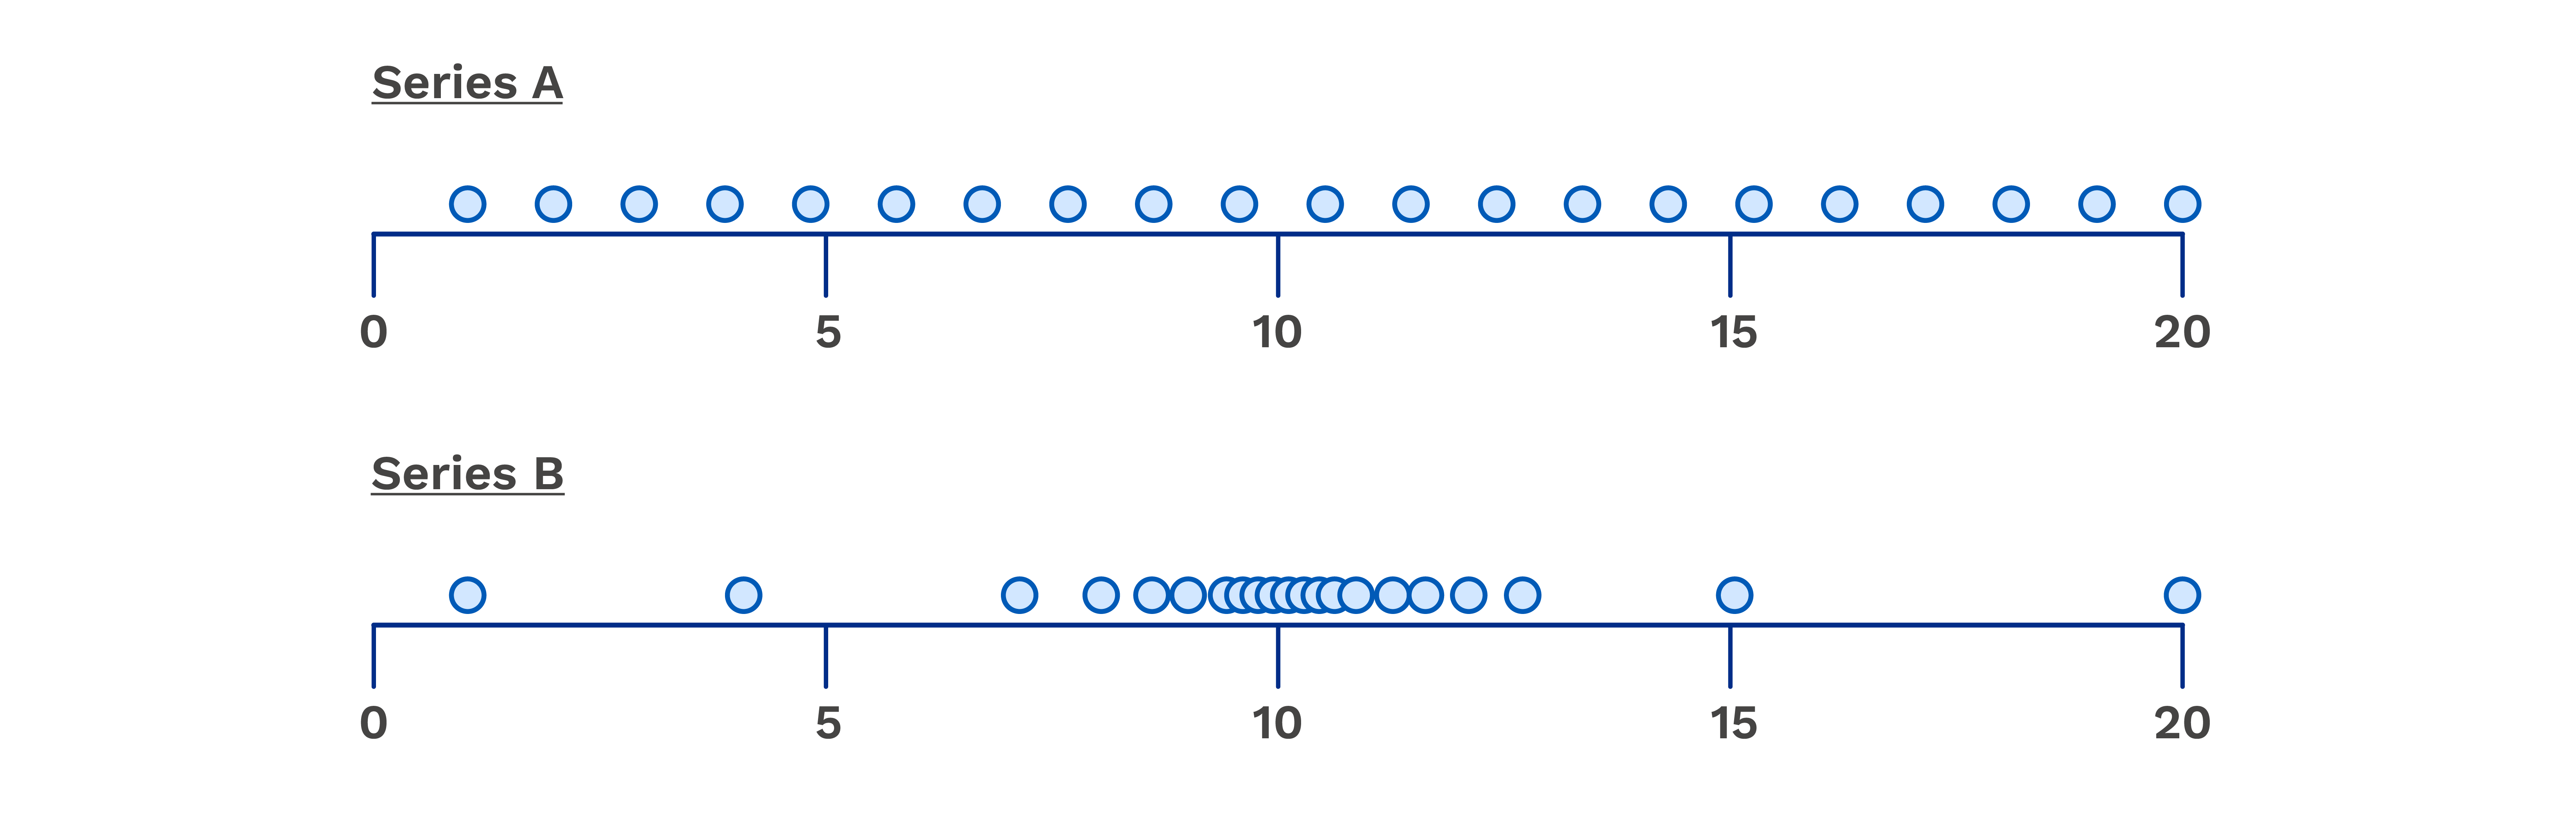
To illustrate, consider two series, A and B.
Both series have the same minimum value of 1 and maximum value of 20, giving a range of 19.
However, the way the data points for the two series are distributed is vastly different. The observations for Series A are evenly spaced out over this range, while those for Series B are more clustered around the value of 10.
The range does not capture this difference.
Two Series with the Same Range but Different Spread
The range is sensitive to the presence of outliers.
This is because the range is computed based on the maximum and minimum values only.
For example, most of the observations in the series below are clustered around the values of 40 to 60, suggesting a range of around 20.
However, with two outliers with values of 0 and 100, the range for this data series is 100. This may not give a good indication of the observations in the series.
Impact of Outliers on Range
