Incidence
Understanding the concept of incidence, its uses and limitations
Last updated on 1 November 2026
Understanding incidence
Besides knowing the prevalence of a labour market phenomenon or practice in the overall labour market, one may also be interested in its prevalence within a subgroup, such as within an industry or age group. This is where the concept of incidence applies.
Computing Incidence
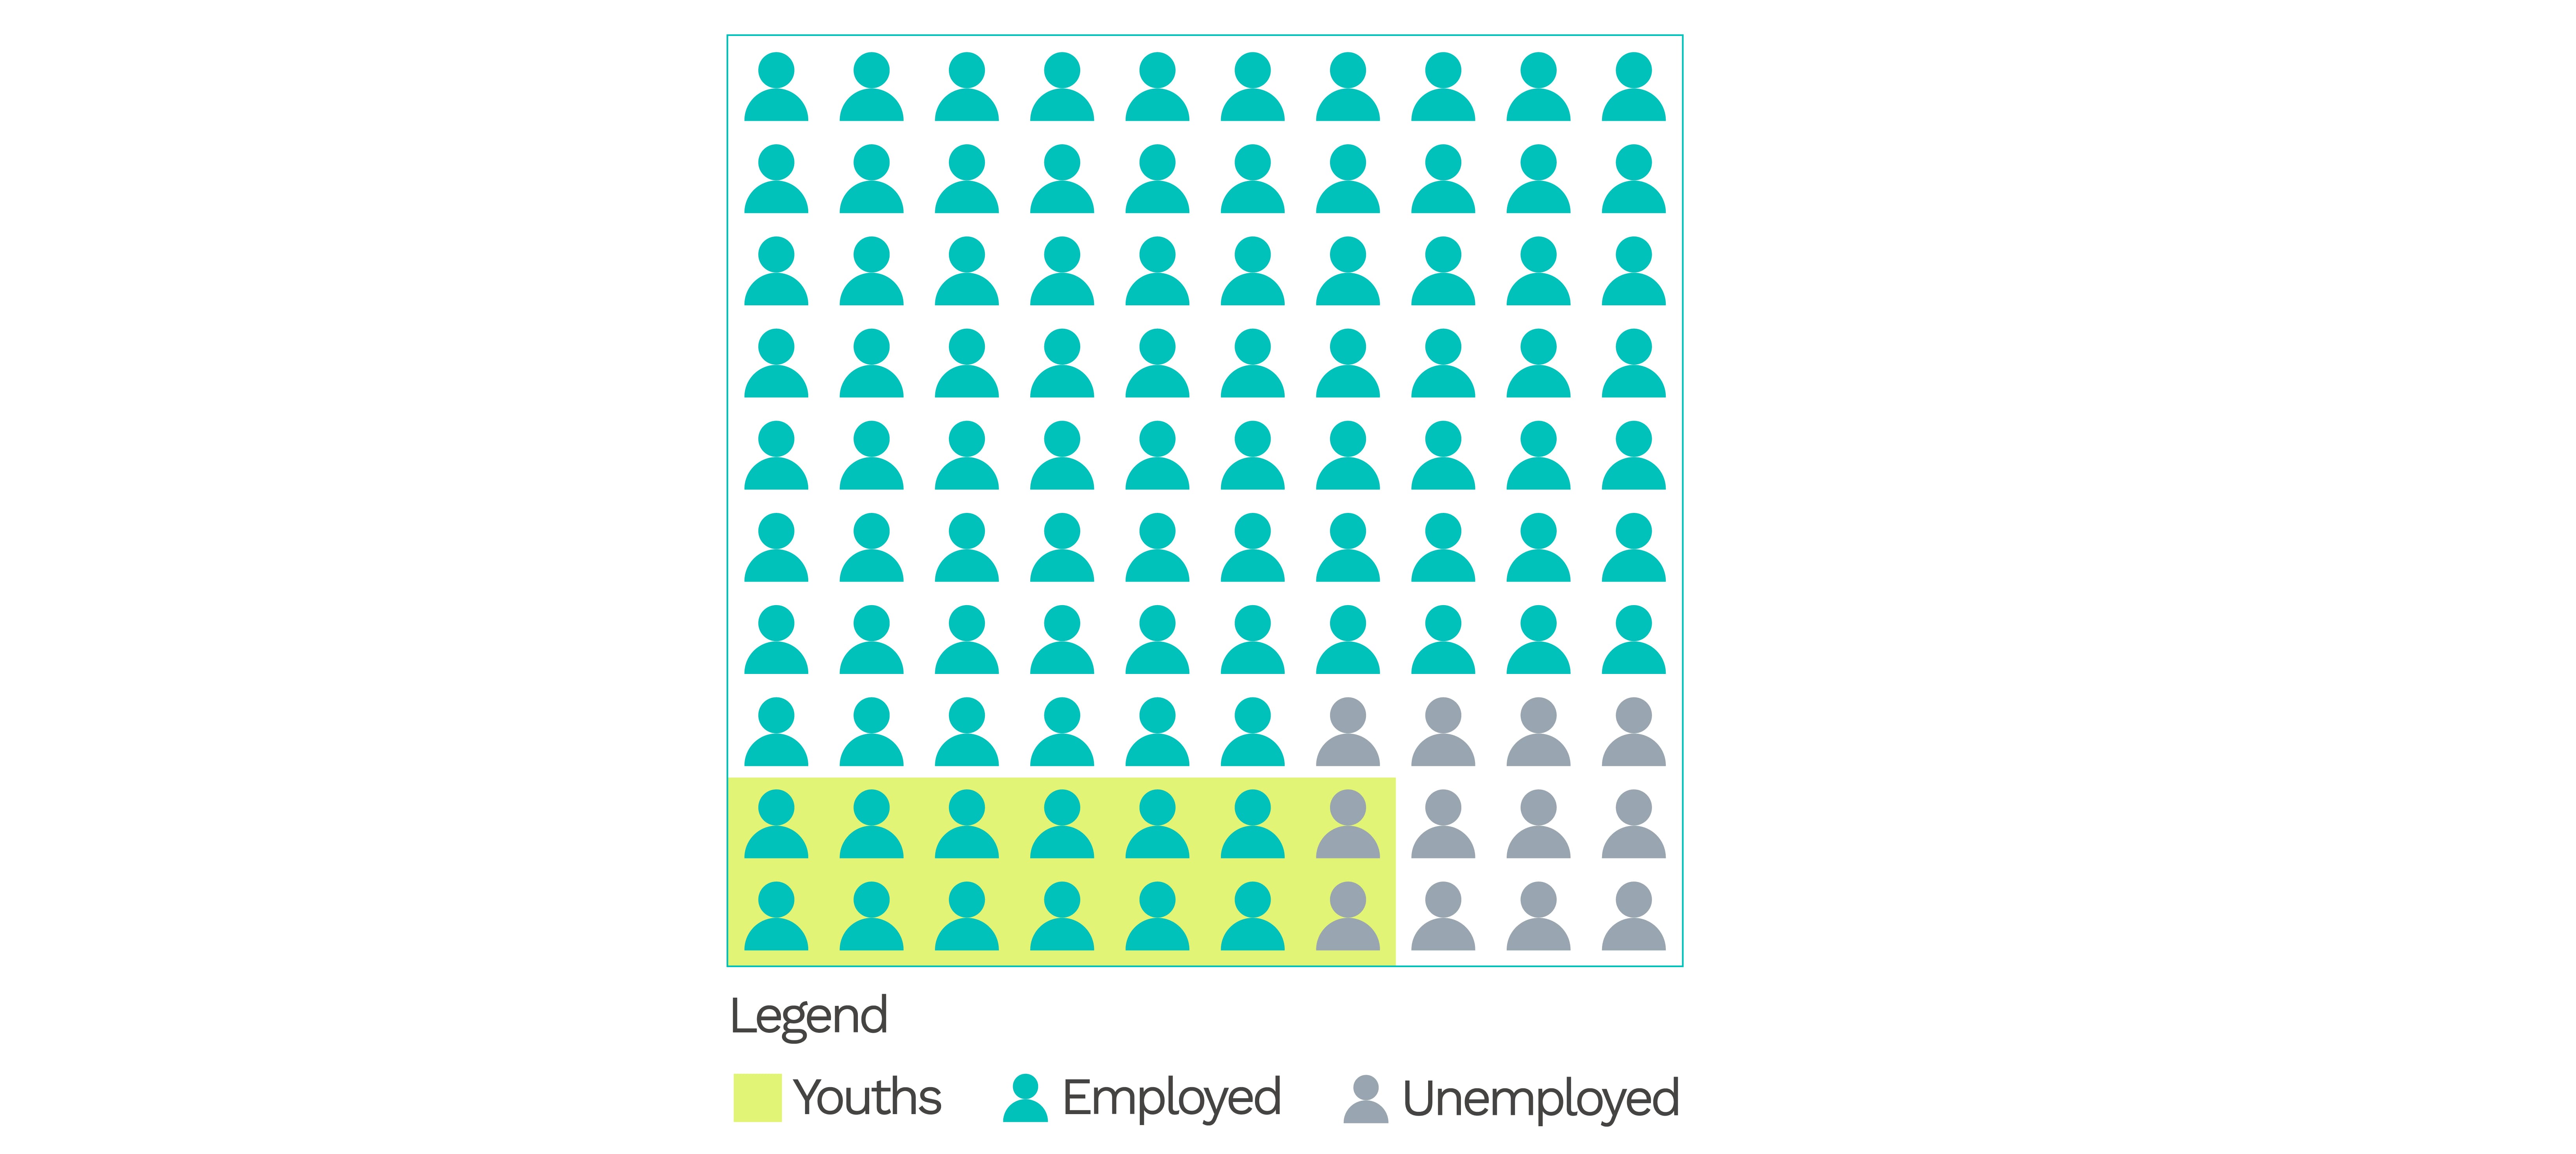
Suppose there were 100 persons in the labour force in a fictitious town, Sampleville. 88 of them were employed and 12 were unemployed.
The incidence of unemployment, or unemployment rate, in Sampleville is computed by dividing the number of unemployed by the labour force size, i.e. 12/100 x 100% = 12%.
To compute the incidence of unemployment for youths in Sampleville, denoted by the region shaded in yellow in the figure below:
First, we compute the number of youths in Sampleville’s labour force (14)
Next, we compute the number of unemployed youths in Sampleville (2)
Finally, the incidence of unemployment, or unemployment rate, among youths in Sampleville is 2/14 x 100% = 14.3%
Labour Force in Sampleville
More generally, incidence figures for a subgroup within the population can be computed using the same formula for that of the whole population, but restricted to the units of measure (e.g. people, companies) within that subgroup.
Example 1
Suppose you would like to find out the incidence of unemployment, or unemployment rate, among residents aged 40 & over in Singapore.

Applying this formula for residents aged 40 & over,
Number of unemployed residents aged 40 & over in June 2010 = 35,400
Number of residents aged 40 & over in the labour force in June 2010 = 1,095,700
Hence, incidence of unemployment or unemployment rate for residents aged 40 & over:

Example 2
Suppose we want to find out the prevalence of term contract employment among non-permanent workers.
Overall, the incidence of term contract employment is computed using the following formula:

Applying this formula to the data for professionals only (for time period June 2010):
Number of resident employees in professional jobs working on term contracts = 29,500
Number of resident employees in professional jobs = 291,500
Therefore, incidence of term contract employment among resident employees in professional jobs.

Uses of incidence
Incidence data helps us understand the extent to which a certain labour market phenomenon or practice occurred across different segments of the population, or at different points in time.
Comparison over time
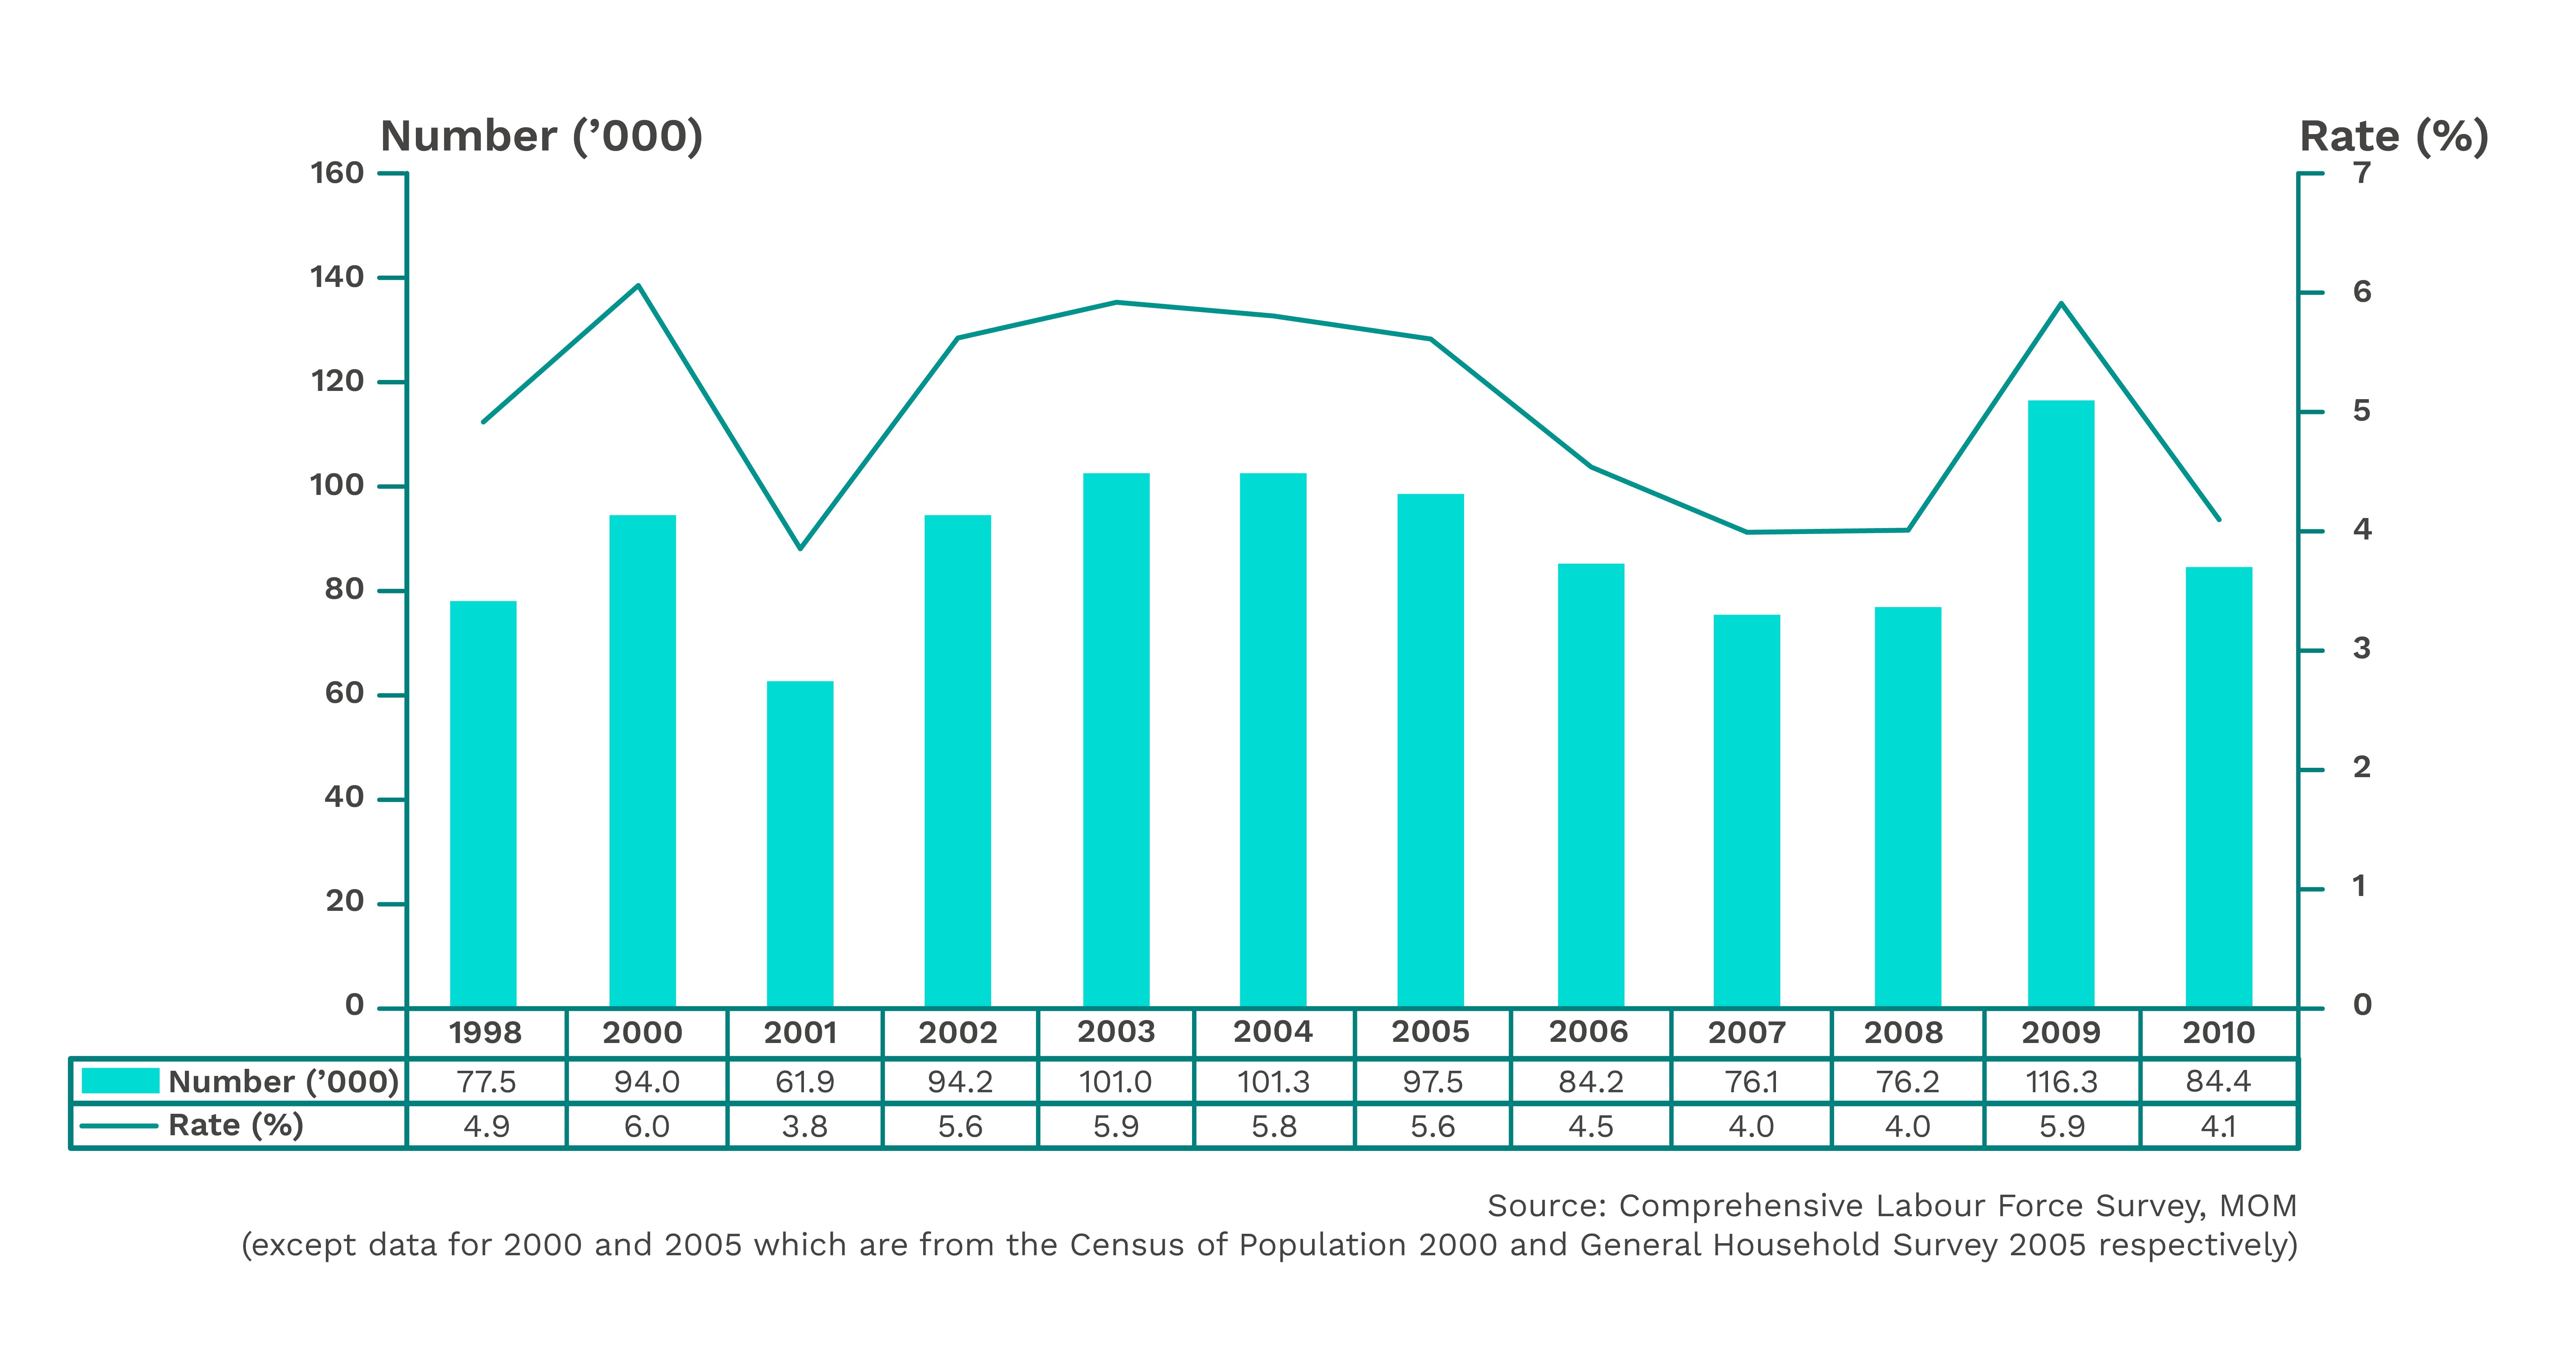
With only information on the number of unemployed residents in June 1999 (77,500) and June 2010 (84,400), one may conclude that unemployment was more severe in June 2010 than in June 1999.
However, the actual number of unemployed persons is also affected by changes in the population size, which has an impact on how big the labour force and the unemployed pool is. In our current context, the population grew over time, which has an upward impact on the size of the labour force and the unemployed pool.
Hence, a fairer comparison of the extent of unemployment over time can be made by looking at the unemployment rate, which normalises the size of the unemployed pool by the labour force size in each period. The resident unemployment rate in June 2010 was 4.1%, lower than 4.9% in June 1999. This means that unemployment was less severe in June 2010 than in June 1999.
Resident Unemployment Rate and Number, 1999 to 2010 (June) (Non-Seasonally Adjusted)
Comparison across subgroups
Similarly, incidence data provides a fairer comparison of the extent to which a labour market practice or phenomenon affects different subgroups of the population. This is especially the case when the size of one subgroup is much larger than the other.
For example, in June 2010, there were 20,600 unemployed residents with below-secondary qualifications, and 20,800 unemployed residents who were degree holders. These figures by themselves seem to suggest that the impact of unemployment on the two groups is similar.
However, the above figures do not account for the difference in labour force size of the two education groups. There were 565,400 degree holders in the resident labour force in June 2010, higher than the number of 455,300 in the below-secondary group.
After computing the unemployment rate for both groups (i.e. dividing the number of unemployed residents in each group by their respective labour force size), we find that the below-secondary educated had an unemployment rate of 4.5%, higher than 3.7% for degree holders. Hence, unemployment was more prevalent among the below-secondary group than among degree holders.
Limitations
Confusion over the concept of incidence and distribution
When analysing unemployment by education, one can express the number of unemployed residents in each education group as a percentage of the
a) resident labour force for the same education group (concept of incidence), or
b) total number of unemployed residents (concept of distribution).
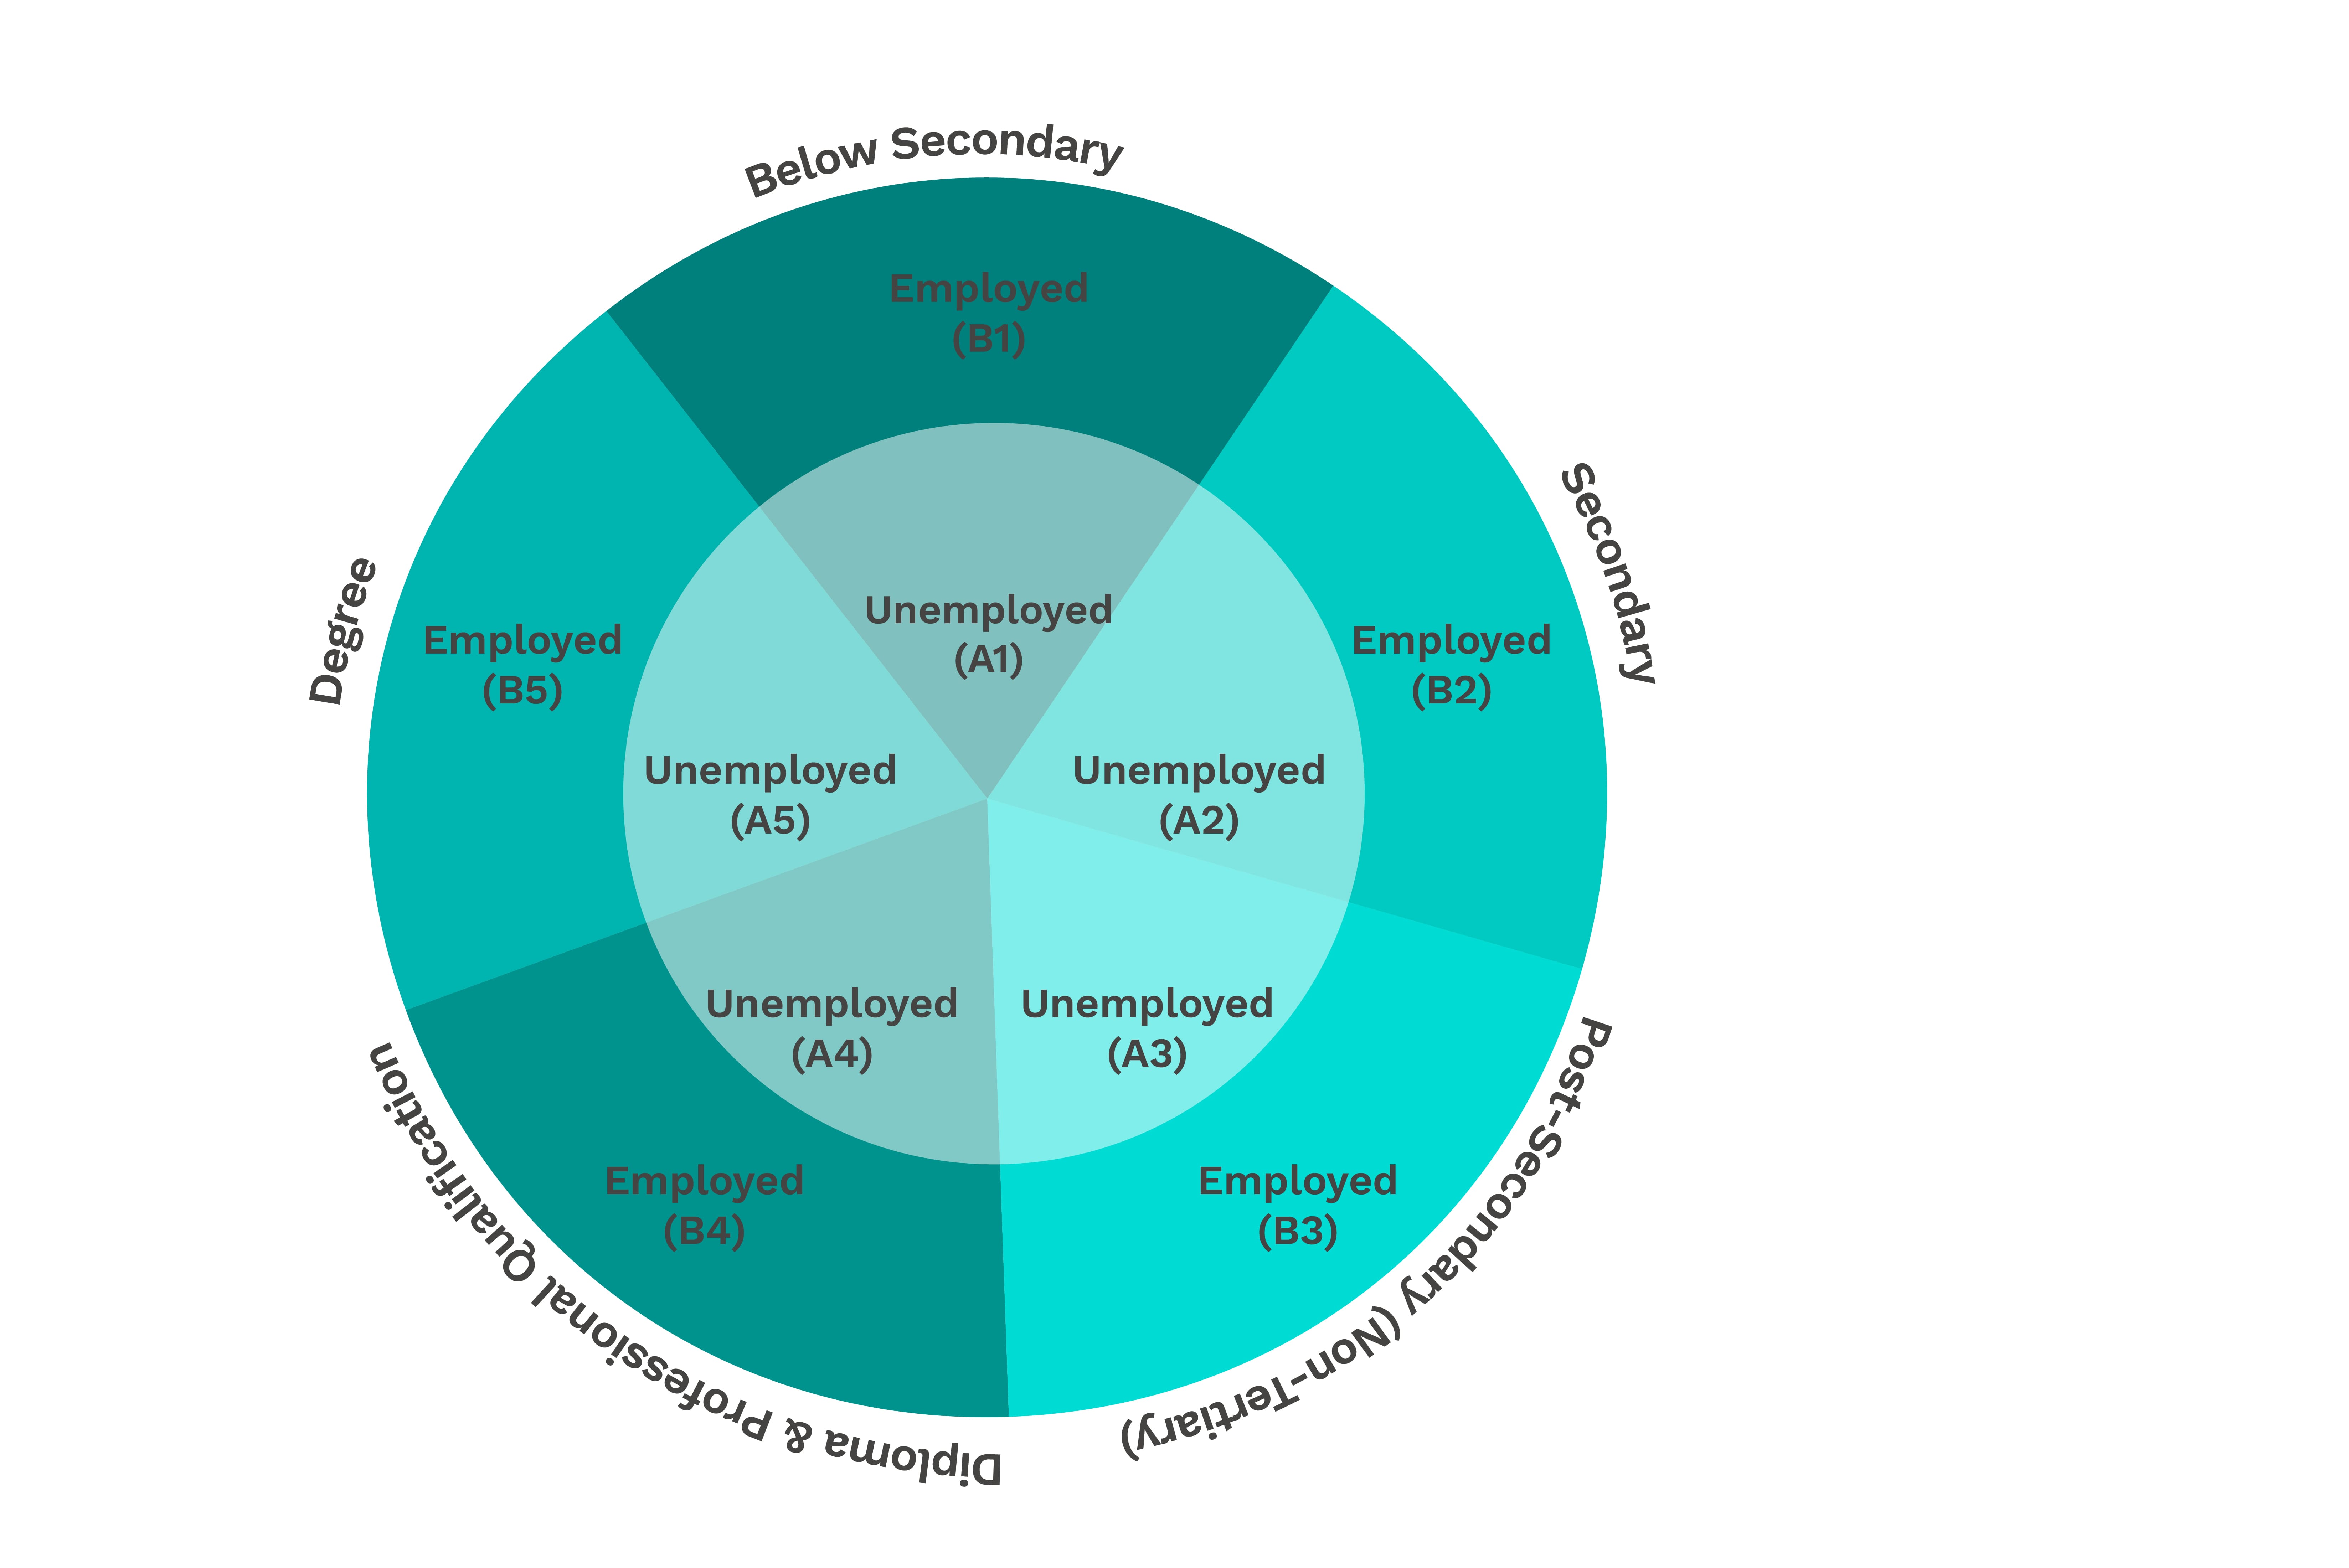
For example, referring to the following figure, the incidence data (or unemployment rate) for the below-secondary group is computed by taking the number of people in region A1 divided by the sum of the number of people in regions A1 and B1.
The distribution data (or distribution of unemployed residents) for the below-secondary group is computed by taking the number of people in region A1 divided by the sum of the number of people in regions A1, A2, A3, A4 and A5.
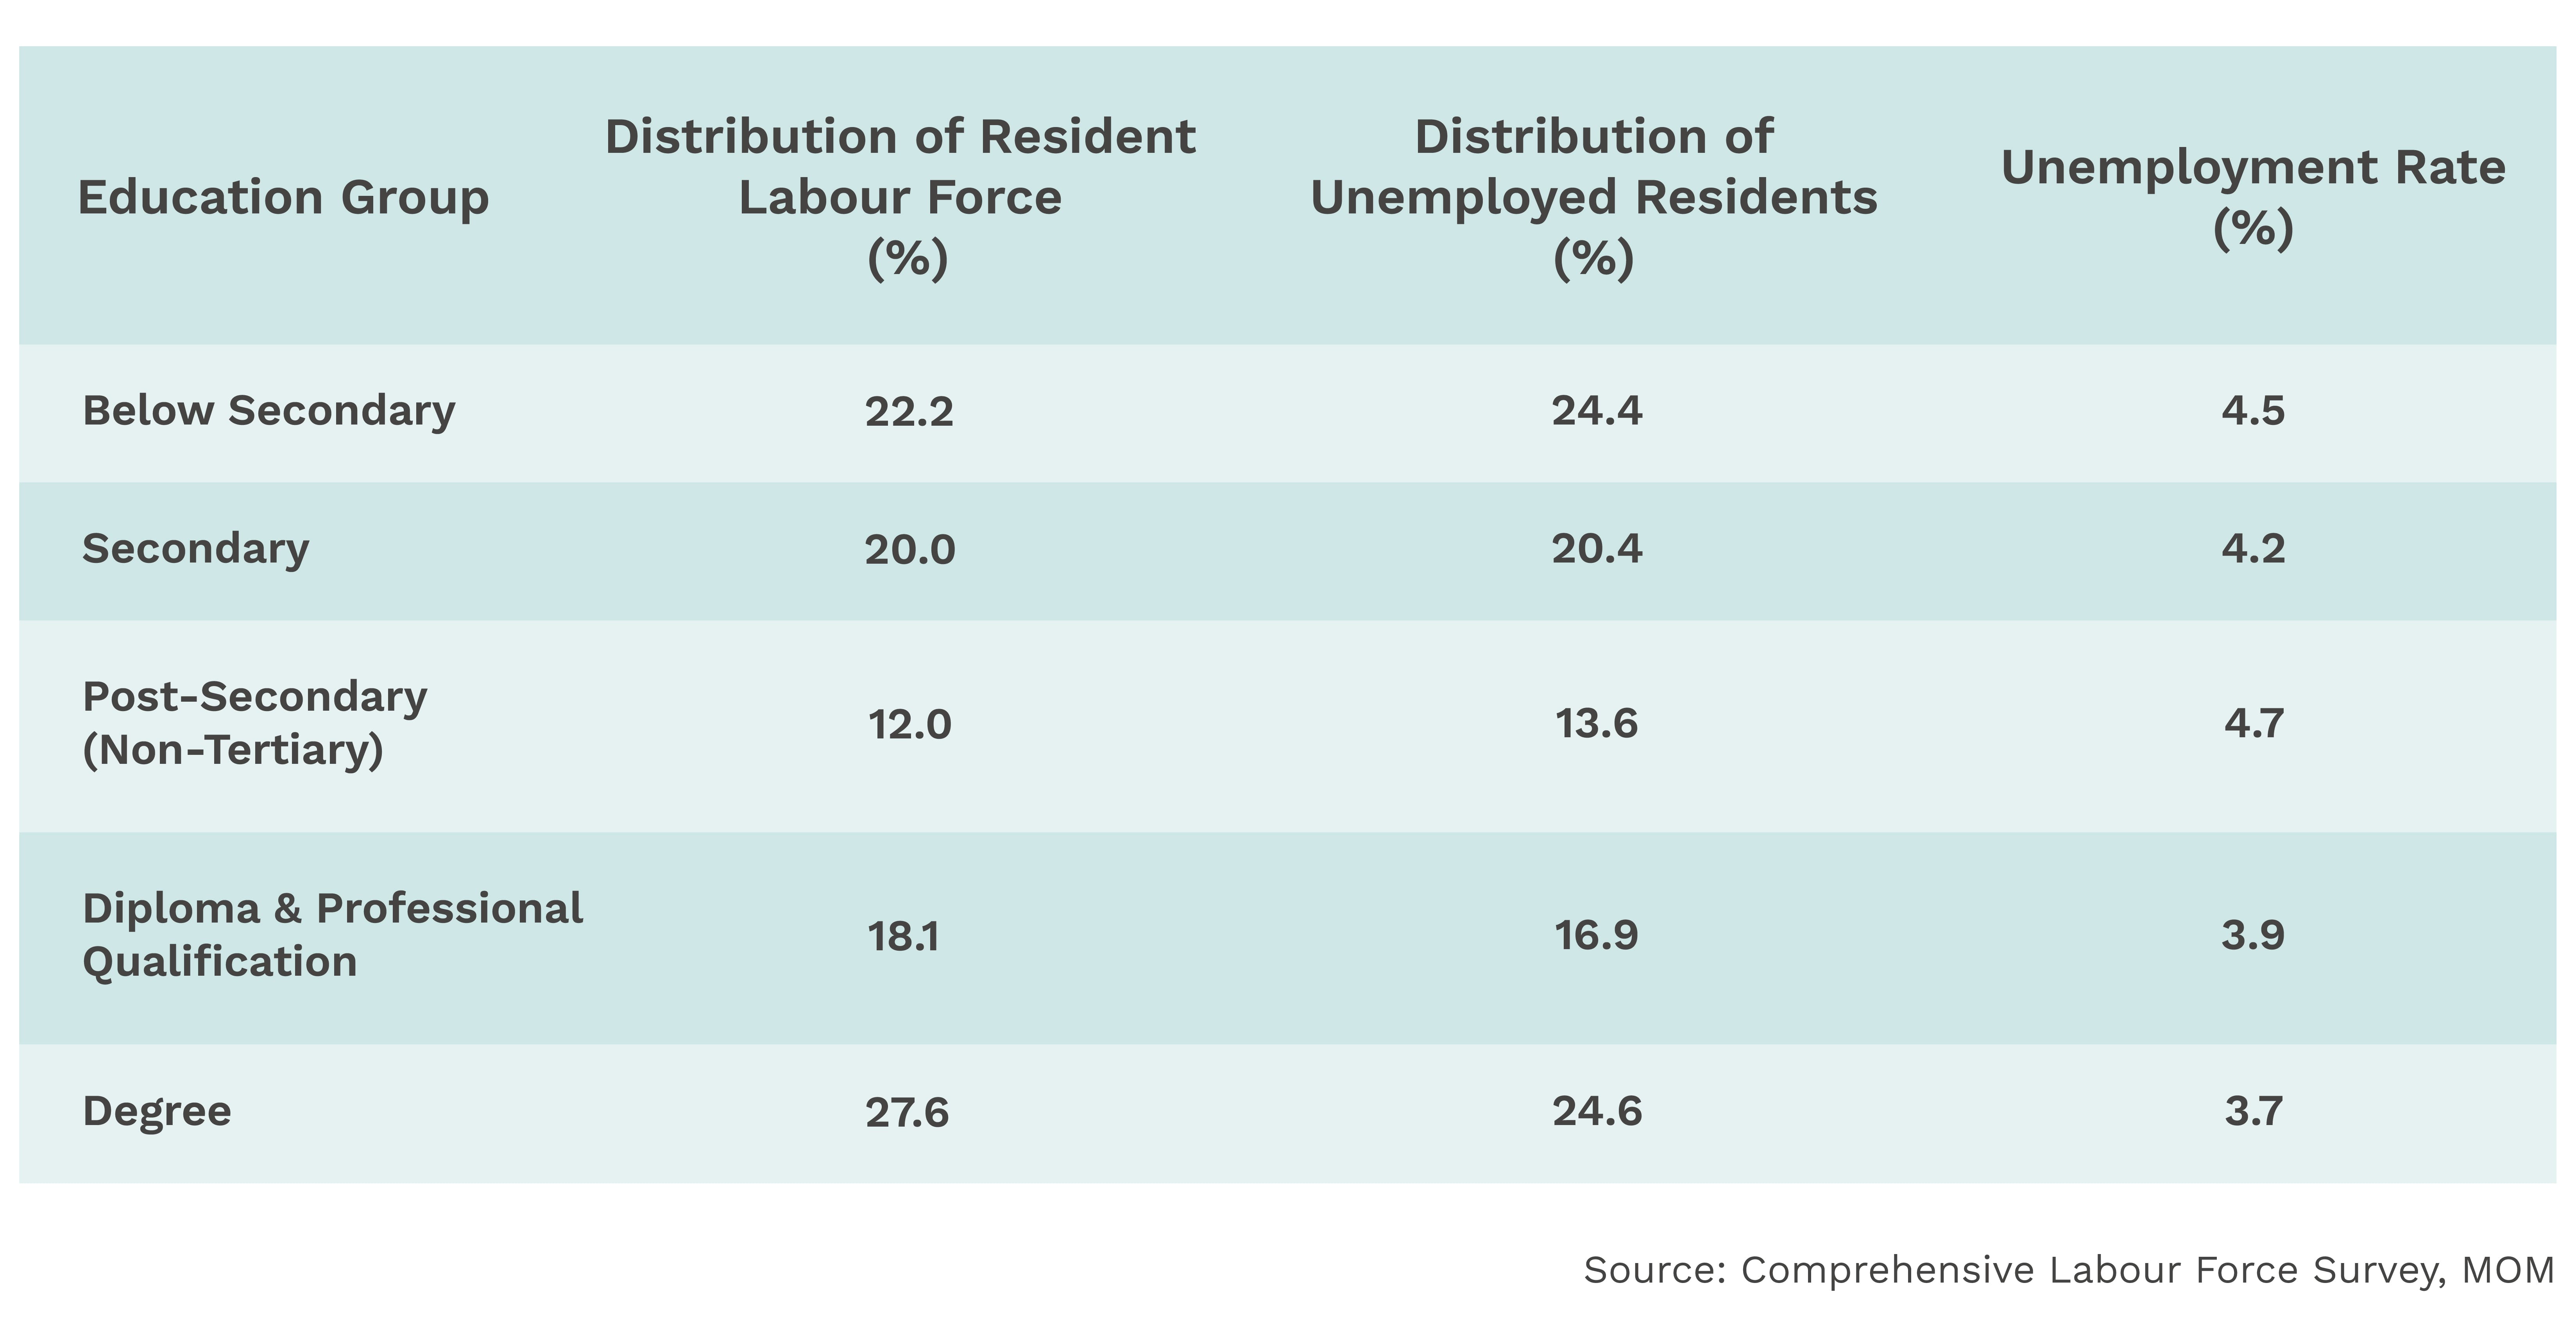
The formula for computing the data for the other education groups can be found in the table below.
Computing incidence and distribution data for different education groups
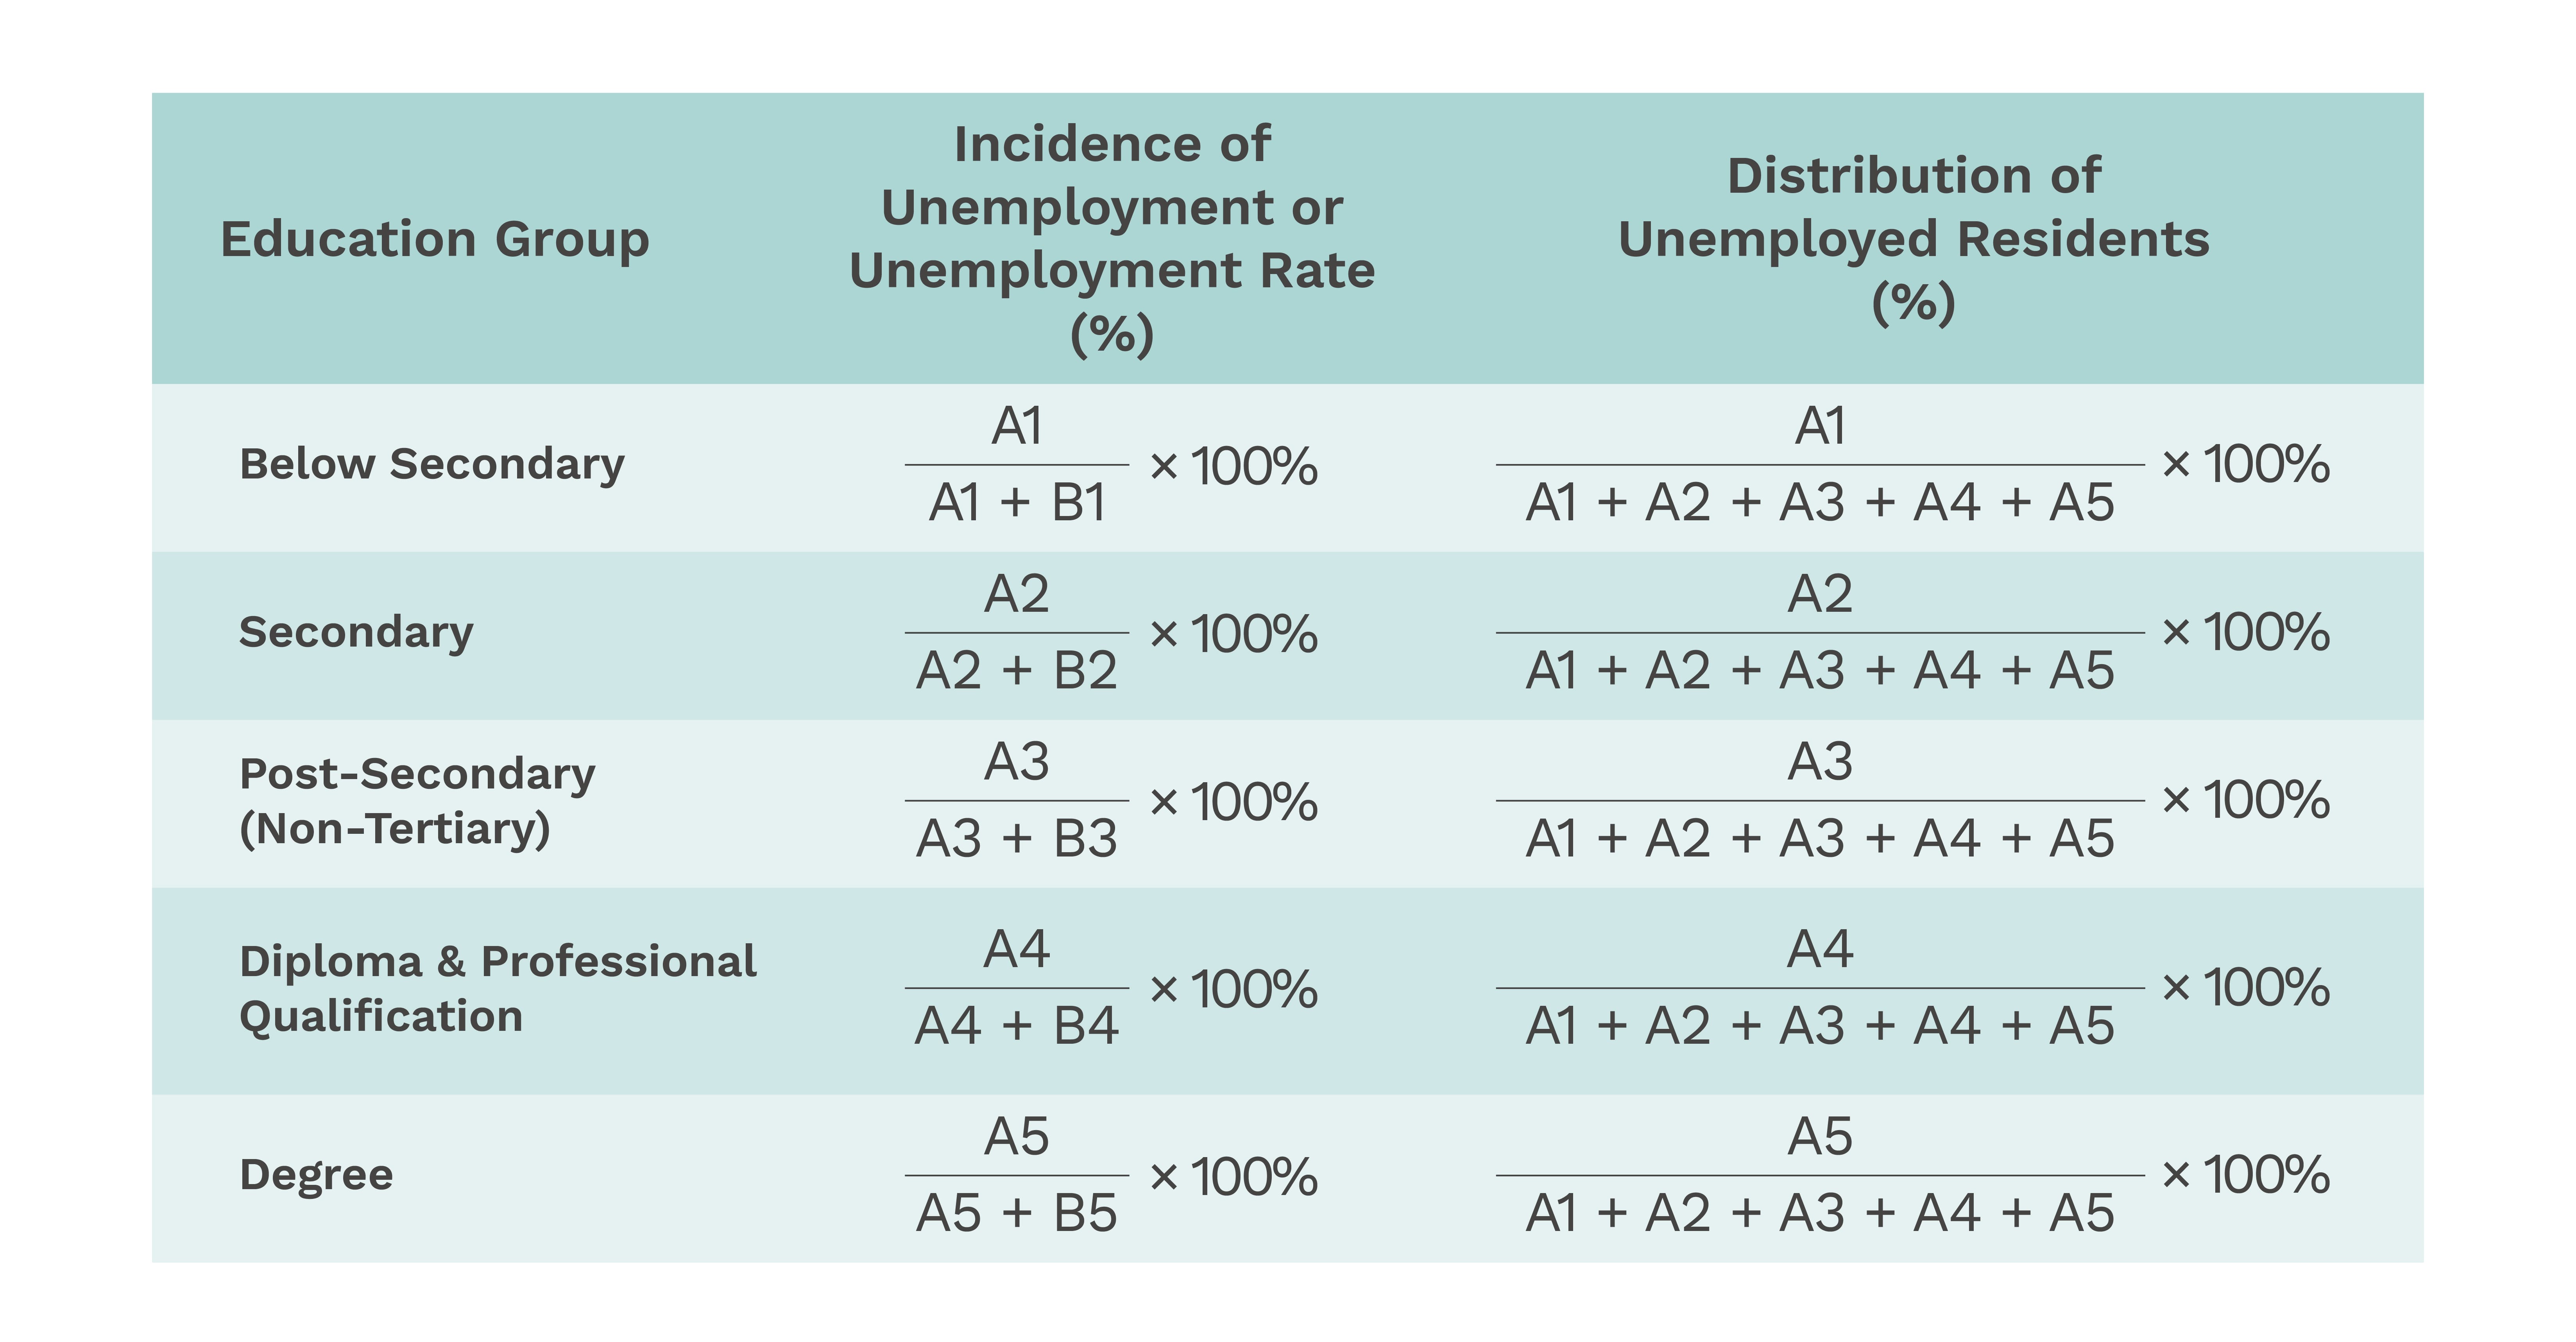
The percentages in (A) help us compare the vulnerability of the different education groups to unemployment, after factoring the differences in their labour force size. This helps us identify the education groups with higher incidence of unemployment or unemployment rate. Appropriate policies or assistance measures targeted at these groups can then be designed to help them improve their labour market performance.
On the other hand, the percentages in (B) help us better understand the profile of the pool of unemployed residents in terms of their educational profile. This can help agencies customise job search assistance programmes that better match the profile of the unemployed residents.
A subgroup of the population with a high incidence for a specific labour market outcome or practice does not necessarily form a high percentage of those with this outcome or practice. That is, their distribution figures may not necessarily be high.
For example, while the post-secondary (non-tertiary) group had the highest unemployment rate among the five education groups in June 2010, their percentage distribution figures were the lowest among the five groups. This can be attributed to the relatively small labour force size for this education group.
This means that although residents with post-secondary (non-tertiary) qualifications were more vulnerable to unemployment than the average resident, they formed a relatively small share of unemployed residents in Singapore.
Labour Force and Unemployment Indicators by Educational Attainment, June 2010