Quantitative vs Qualitative
Understanding the concepts of quantitative and qualitative data, their uses and limitations
Last updated on 1 November 2026
Understanding quantitative and qualitative data
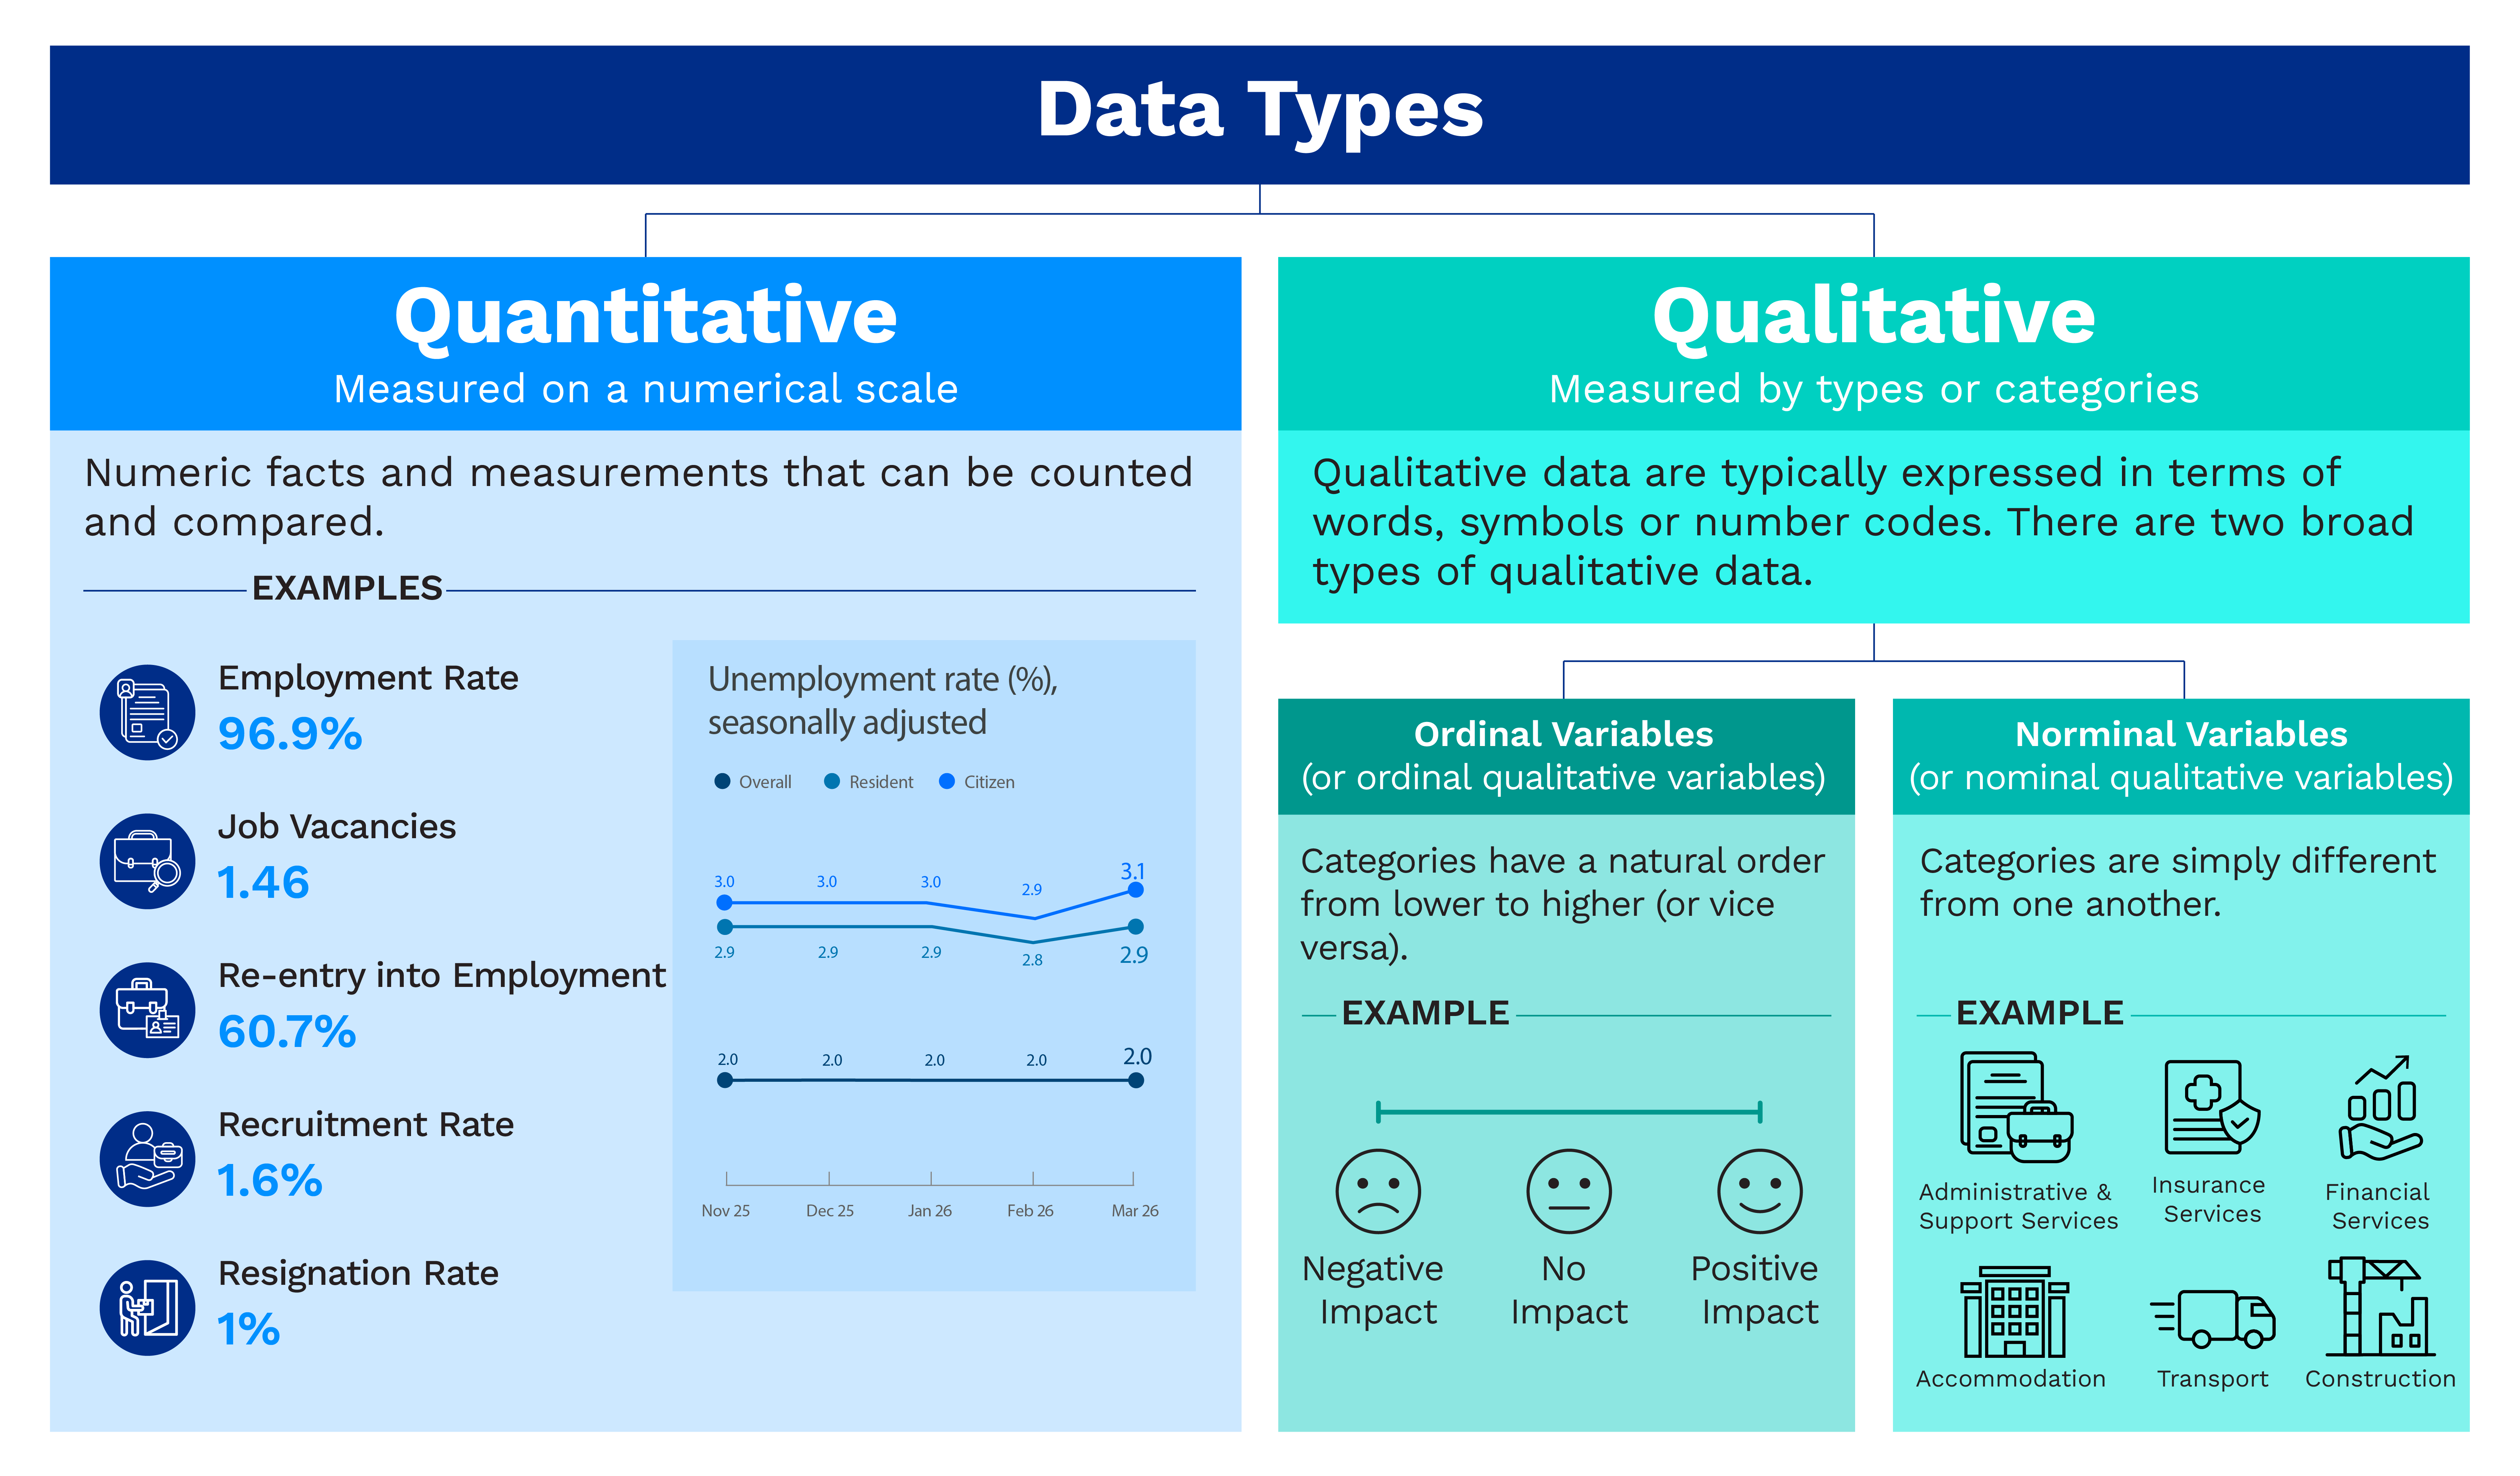
To obtain a more holistic picture of the health of the labour market, we often draw on data from various sources and types. Typically, both quantitative and qualitative data are used.
Uses of qualitative vs quantitative data
Quantitative and qualitative data complement each other in helping us to better understand the labour market.
Quantitative data
We can use quantitative data to compare the exact size and extent of difference between two quantities.
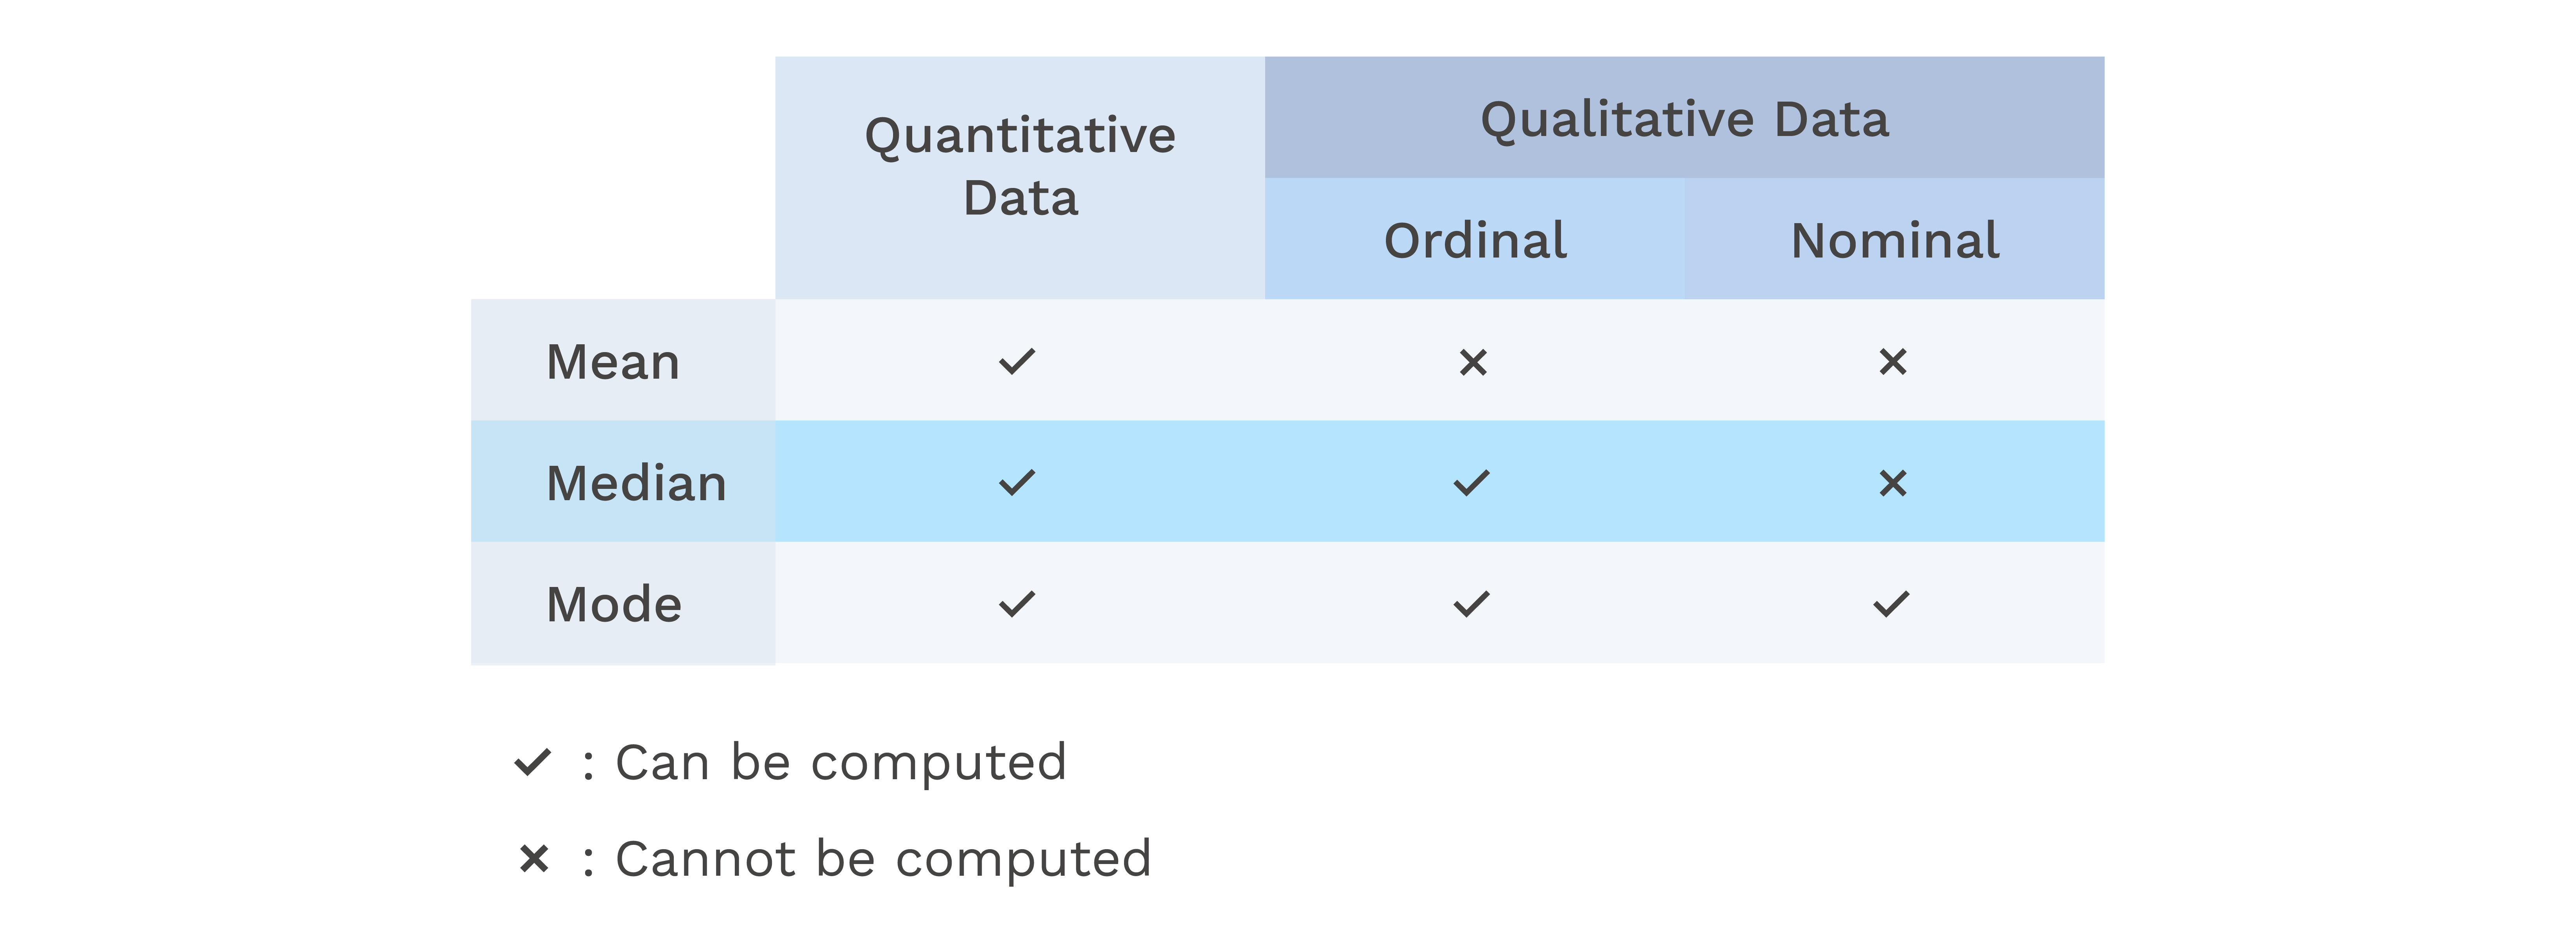
With quantitative data, we are also able to compute summary measures of the variable, such as the mean, median or mode. This gives us a concise way to understand the variable being measured, such as the median age of workers in an industry.
Ordinal qualitative data
For ordinal qualitative data, we can determine the most common category (or the mode), as well as the category that contains the median observation (or the one that divides the bottom half of observations from the upper half).
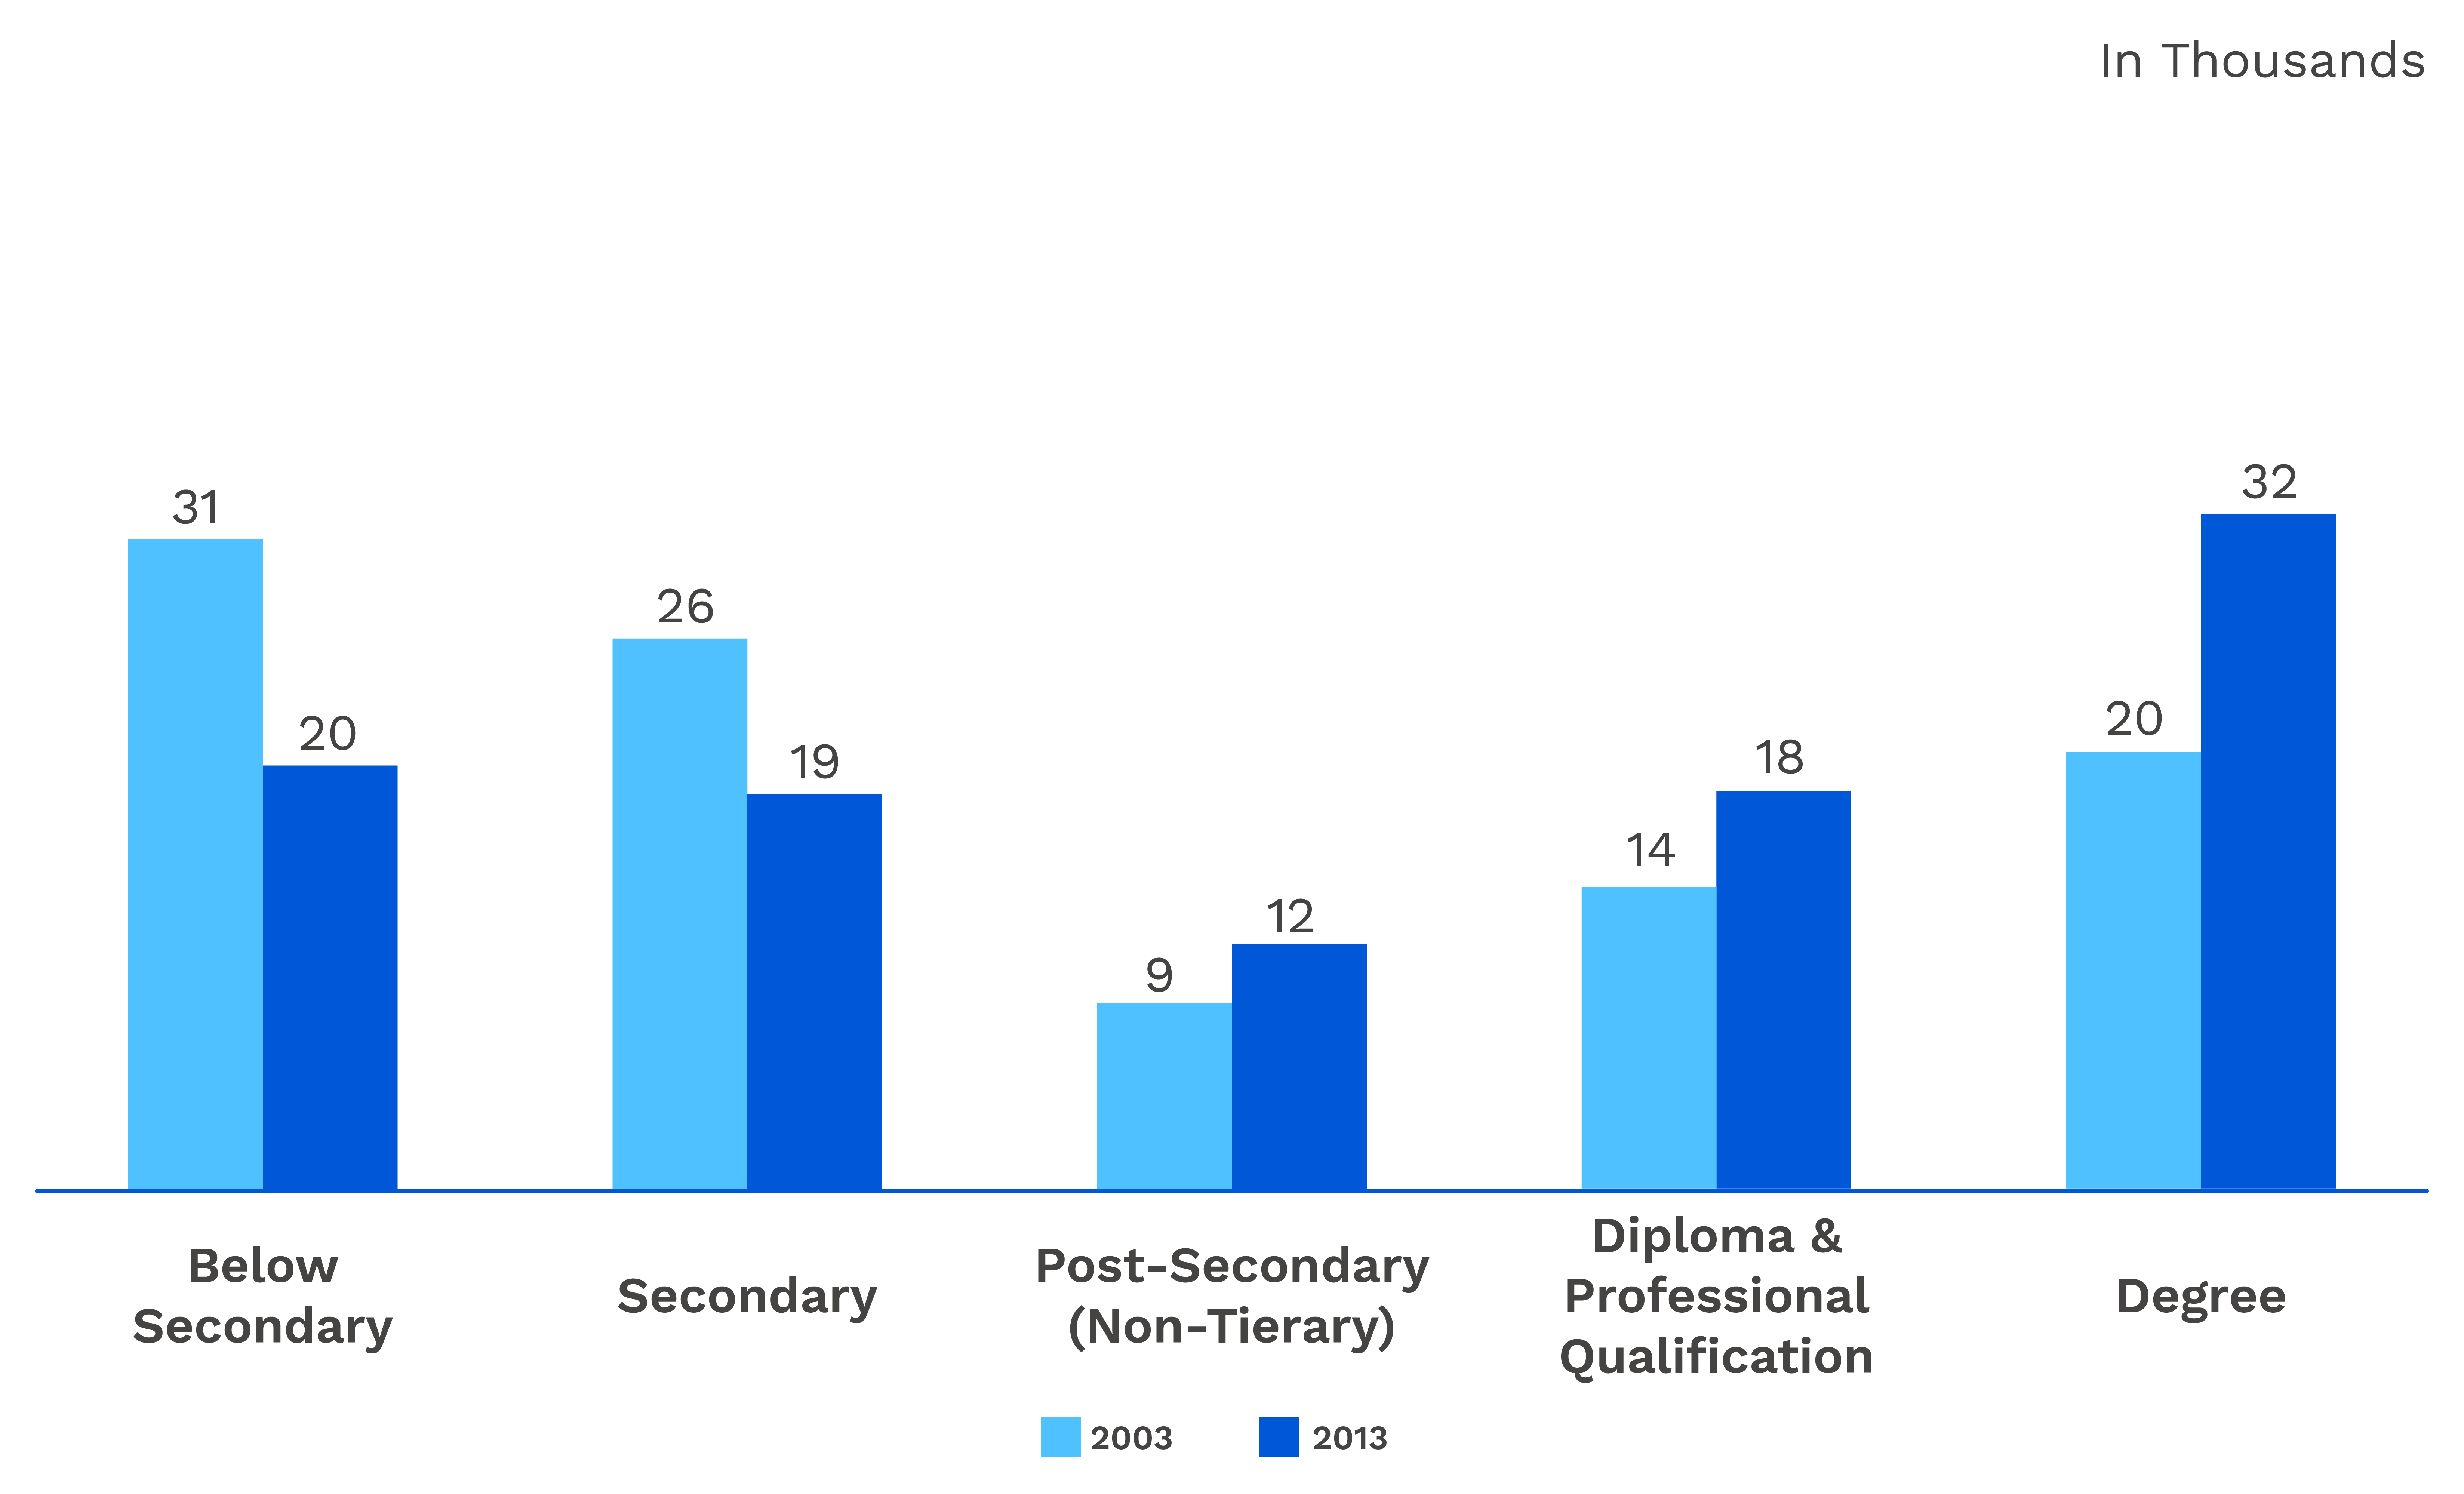
For example, let us look at the highest qualification attained by Coconut Island’s resident labour force.
In the chart below, qualifications to the right are ordered higher than those on the left:
Coconut Island’s Resident Labour Force by Highest Qualification Attained
However, we cannot quantify the extent of their difference. As such, the mean of this variable cannot be determined.
Nevertheless, we are still able to derive the median and mode of this variable. In 2013, “Below Secondary” was the most common education category, while the median person in the resident labour force had Secondary qualifications.
In 2023, “Degree” was the most common education category, while the median person in the resident labour force had Post-Secondary (Non-Tertiary) qualifications.
Nominal qualitative data
As the categories in nominal qualitative variables have no natural ordering and their extent of difference cannot be quantified, we are not able to derive the median, which requires ordering, or the mean of such variables.
However, we can derive the mode, which refers to the category that contains the largest number of observations in the dataset.
An example of a nominal variable is the industry for job vacancies on Coconut Island.
For this case, it is not possible or logical to derive the mean or median industry where the job vacancies come from. However, we can derive the mode, which refers to the industry with the largest number of job vacancies.
Job Vacancies by Industry on Coconut Island
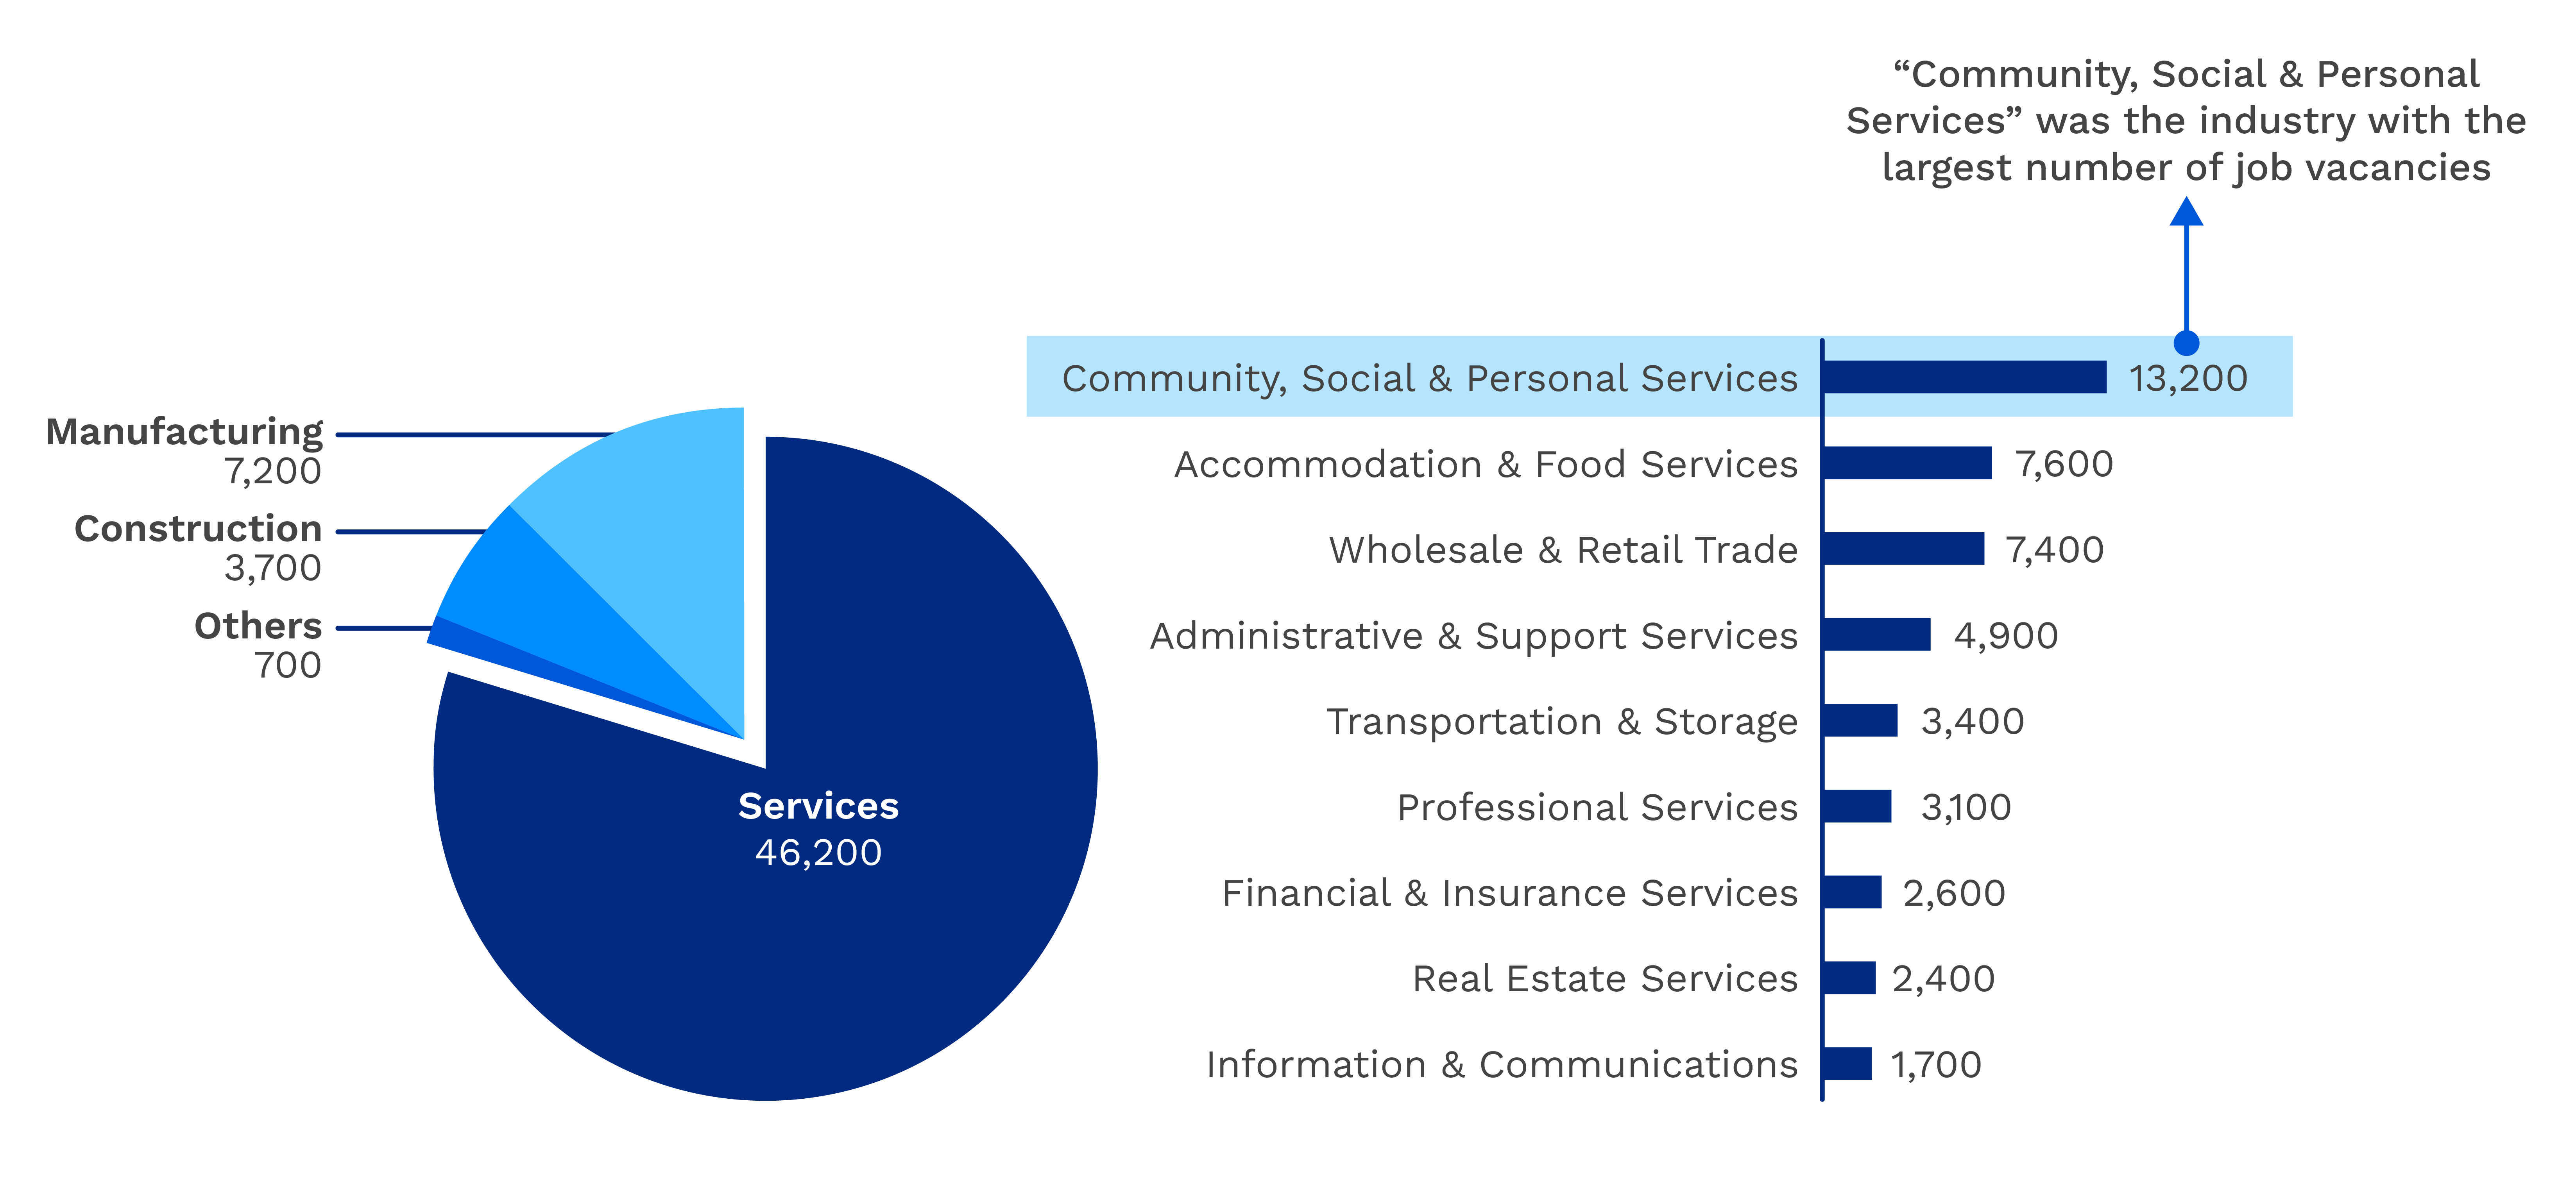
In this example, Community, Social & Personal Services, with 13,200 job vacancies, is the industry with the largest number of job vacancies.
The averages that can be computed for each type of data are summarised below:
Limitations
Qualitative data in number codes is not the same as quantitative data
Qualitative data may sometimes be expressed using number codes.
For example, to illustrate the ordering of the impact of training on staff performance from most negative to most positive, the three responses may be coded as:
Impact of training on staff performane
Code | Response |
1 | Negative Impact |
2 | No Impact |
3 | Positive Impact |
To take another example, while industry is a nominal variable, we may assign numerical labels to various industries for coding purposes or to illustrate its hierarchical structure.
For example:
Industries
Code | Industry |
46 | Wholesale Trade |
56 | Food & Beverage Services |
85 | Education |
When the values that a qualitative variable can take are expressed in number codes, we may mistake them for quantitative variables and think that we can perform further arithmetic operations on them, such as computing their mean or subtracting one value from another.
However, the numerical values taken by qualitative variables are merely labels rather than actual quantitative values. They should therefore be treated no differently from qualitative variables expressed in words or letters of the alphabet.
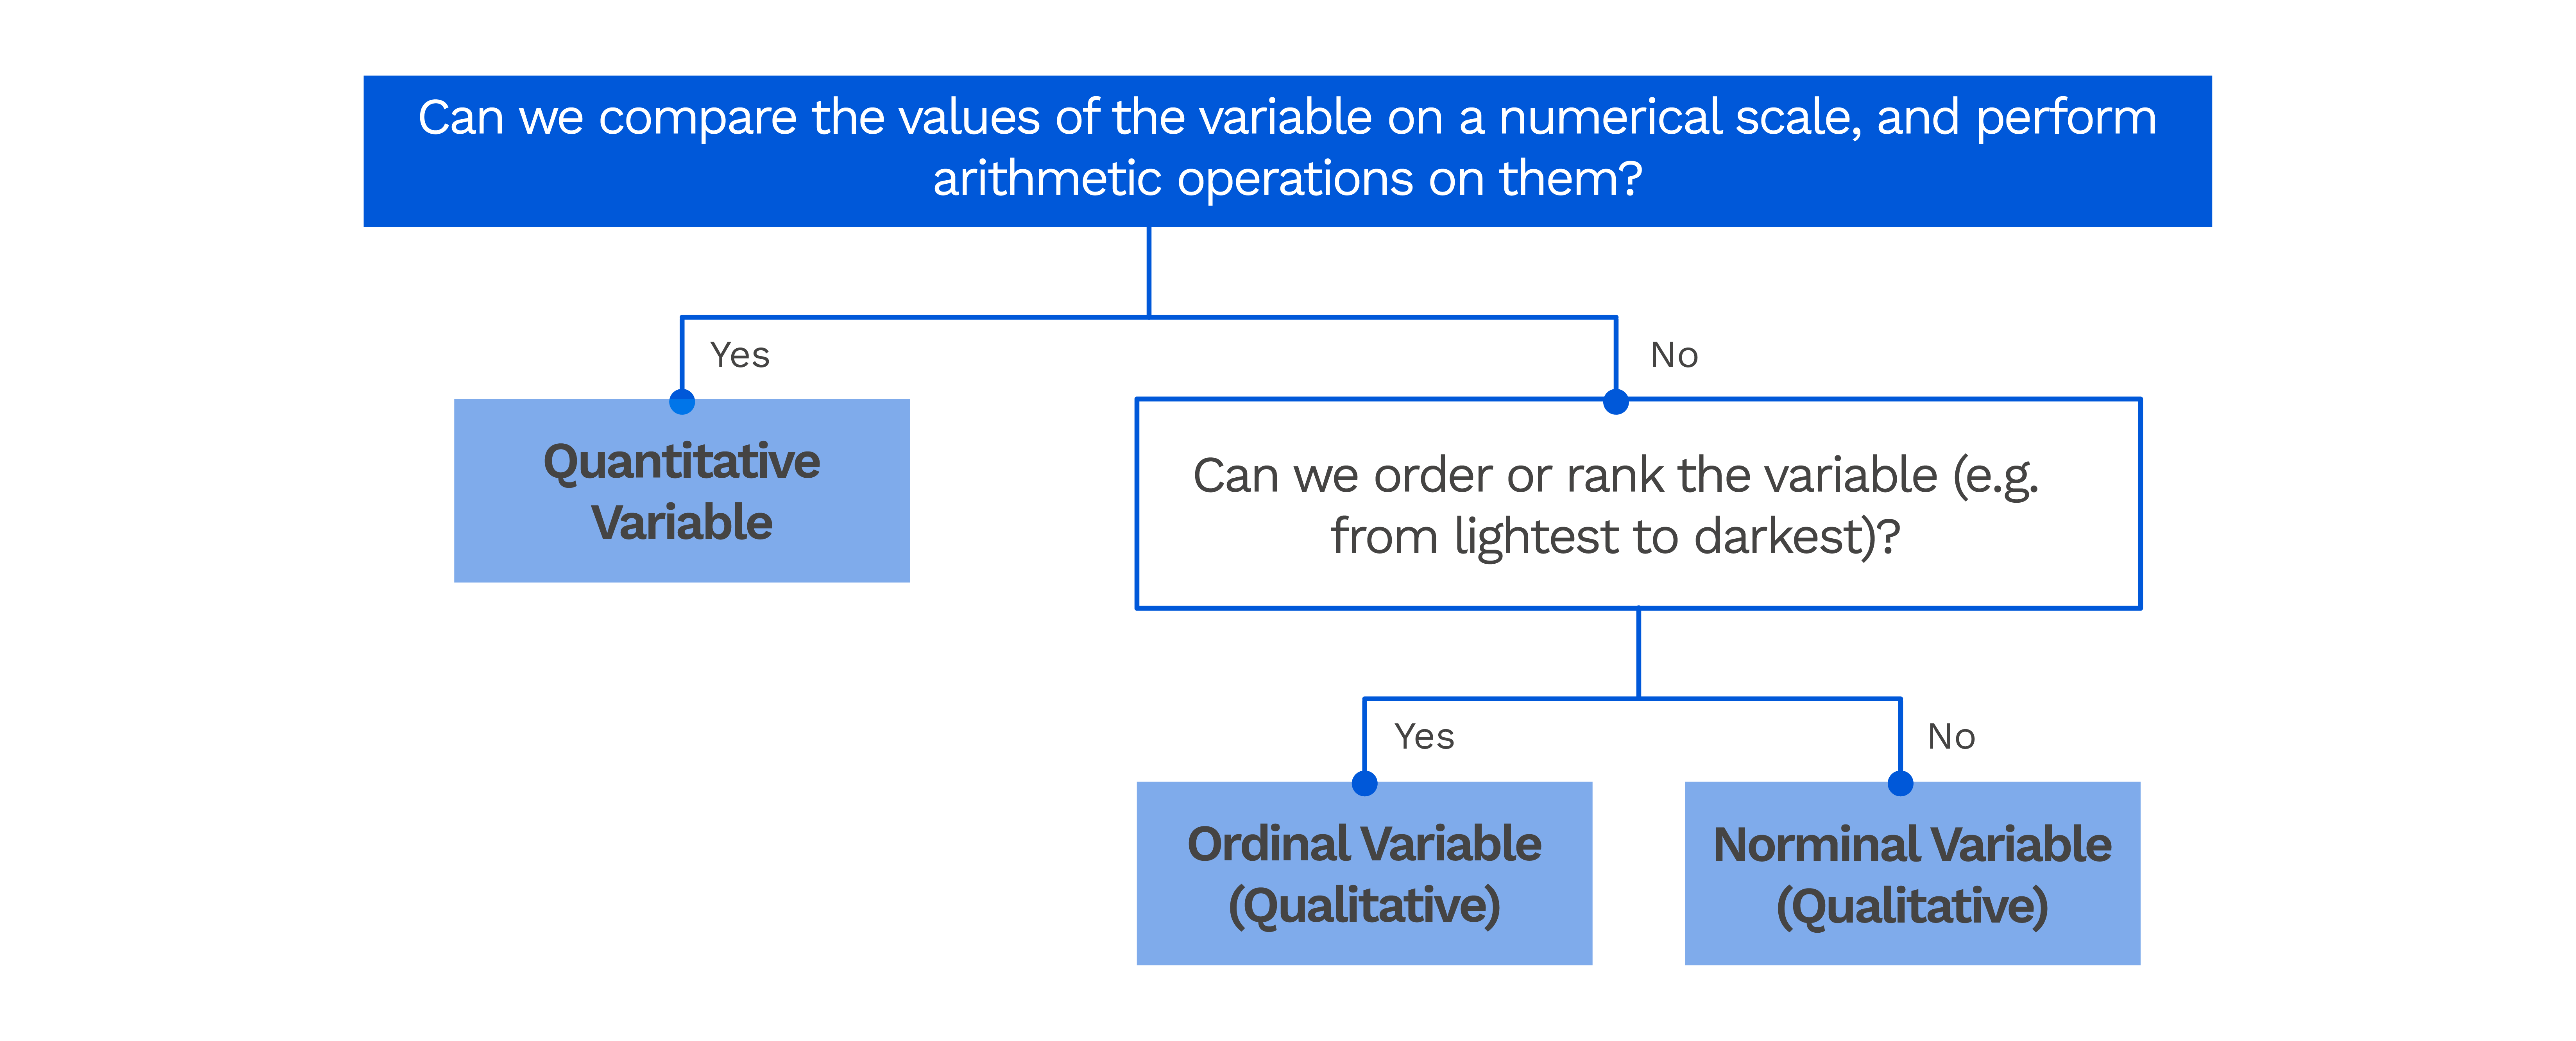
How do we determine if a variable is quantitative, ordinal or nominal?
The following flowchart can help us determine whether a variable is quantitative, ordinal (qualitative), or nominal (qualitative).